Skip to content
-

Pune (Maharashtra)

Integrated Child Development Scheme

This factsheet presents an analysis of the performance of the Integrated Child Development Services (ICDS) scheme in the district of Pune, Maharashtra.

Pune, in Maharashtra state, is one of the most-populous districts in India. According to the 2011 census, its population was 9,429,408, ranking it fourth among India's 640 districts. Read more about Pune

The Integrated Child Development Services (ICDS) is a flagship scheme of the government. It was launched in 1975 with the objective of providing early childhood care and development to children. However, it has since expanded in scope, and now caters to children (age 0-6 years), pregnant and lactating mothers, and adolescent girls. Read more about ICDS

01.

How has the district performed on nutritional indicators over time, compared with the state average?

Section titled How has the district performed on nutritional indicators over time, compared with the state average?

The nutritional status of a district can be determined by a number of indicators that reflect on the health and nutrition of its population. For instance, the percentage of stunted, wasted, anaemic and underweight children in the district is indicative of the unmet nutritional requirements for children of 0-6 years of age. Similarly, the proportion of anaemic women in the district is indicative of the health and nutritional status of pregnant and lactating women, and adolescent girls.

Figure 1: Performance of Pune in select nutritional indicators (%)

  • The district had seen an increase in all adverse nutritional status indicators between 2015 and 2019, especially anaemia in adolescent girls. Borat S. et al. (2020) conducted a study in rural areas of Pune where inadequate diet and deficiency of iron intake was found to be the major cause of anaemia in adolescent girls. The paper also discussed the need for intervention and provision of diet supplements in schools.

02.

Where does the district stand in terms of nutritional status, compared to the state?

Section titled Where does the district stand in terms of nutritional status, compared to the state?

Figure 2: Change in Nutritional Status from 2015-16 to 2019-21 (%)

  • The district has performed worse than the state on the parameters of stunting, wasting and undernutrition. Stunting in Pune has increased many times more than the state.
  • For wasting, the district has recorded an increase of 34%, while the state data reflects no such increase. This indicates a better performance by other districts, enabling a zero-percentage change for the overall average of the state.
  • The level of anaemia among children in the state has increased significantly more than in the district between NFHS 4 and NFHS 5.
  • Despite an increase in the proportion of anaemic women in the district, Pune portrays a comparatively better picture than the state in terms of the increase in the percentage of anaemic women of all ages.
  • However, it again shows a higher increase in the percentage of adolescent women with anaemia.

A World Health Organization (WHO) report from 2014 identifies the health and nutritional condition of adolescent women as important indicators of maternal health. The report recognises that strengthening of maternal health, beginning with adolescent girls, is crucial for the overall improvement of the status of nutrition. In this regard, the increase in the percentage of adolescent women with anaemia indicates unmet requirements, in terms of maternal health.

03.

What factors determine the district’s performance on nutritional indicators among women and adolescent girls?

Section titled What factors determine the district’s performance on nutritional indicators among women and adolescent girls?

There are several determinant factors responsible for Pune’s deteriorating performance on these indicators. These factors could be socio-economic, or health and nutrition related. Their deterioration requires intervention through budgetary provisions such as those provided by the ICDS scheme.

  • This intervention can be in the form of counselling to make a behavioural impact, such as counselling on breastfeeding or during pregnancy,
  • Supplementary feeding and provision of additional food rations to meet the nutritional requirements of children aged 6-36 months, pregnant and lactating women, and adolescent girls.

Figure 3: Factors that show a positive change from 2015-16 to 2019-21: A Comparison between the State and District (%)

Socio-economic factors such as early marriage, early pregnancy, the educational status of women, and nutritional and hygiene factors such as Body Mass Index (BMI) of all women, improved drinking water, and improved sanitation have shown a positive change over the period between NFHS-4 and NFHS-5. However, the district still saw an increase in under-nutrition during that time, as measured by nutrition indicators.

Figure 4: Factors that show a negative change from 2015-16 to 2019-21: A comparison between the State and District (%)

  • The poor performance of the district on nutrition, as shown in Figure 1 and Figure 2, can be seen in light of the negative changes in these indicators. These negative changes are indicative of the lack of access of the concerned population to adequate diet, proper counselling and good maternal healthcare.
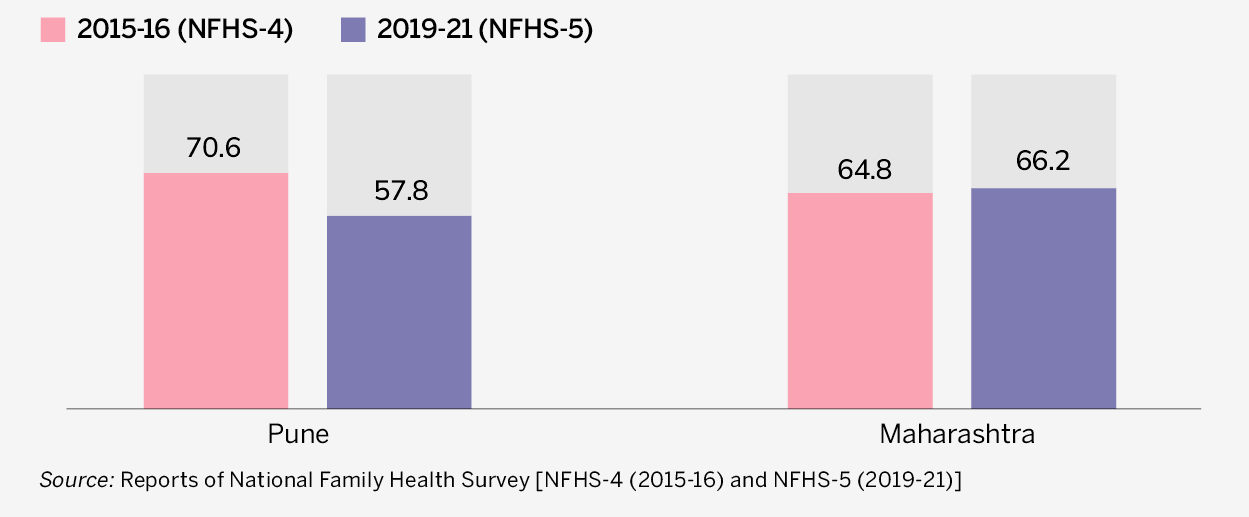
  • An inadequate diet, in particular, is distressing. While Maharashtra as a whole has improved on share of children receiving an adequate diet, Pune district has slipped on this count.
  • A decline in access to proper counselling on breastfeeding, adequate diet for children, antenatal visits and counselling for women on unwanted pregnancies has negatively affected the nutritional status of the district in terms of stunted, wasted, anaemic and underweight children.
  • Thus, to improve nutritional outcomes of the district, there’s a need for better provisioning and intervention through government schemes such as ICDS. For instance, the increasing percentage of stunting, when seen with the falling percentage of children receiving an adequate diet, clearly highlights the need for better provision of supplementary nutrition to children in the district.

04.

How have ICDS funds been spent in the district?

Section titled How have ICDS funds been spent in the district?

Expenditure by the district under ICDS goes to four major components across the four years under review. These are:

  • ICDS General
  • Supplementary Nutrition Programme
  • National Nutrition Mission
  • Anganwadi services

In addition, according to scheme norms of the time, funds are dispensed for Anganwadi construction and Zilla Parishad expenses.

ICDS general

Figure 5: Expenditure incurred on ICDS General by the district: Share of Pune in state expenditure (%)

  • Till 2018-19, allocation of funds for the scheme was under two broad components: ICDS General and Supplementary Nutrition
  • The ICDS General component comprises of salaries, honorarium to Anganwadi workers (AWWs), Anganwadi helpers (AWHs) and other programme components. From 2019-20, following a restructuring of nutrition-specific government schemes and related components, the salary component under ICDS was included under Anganwadi services.
  • In 2018-19, expenditure in the ICDS General component fell, mainly due to a fall in the expense on ‘wages’.
  • As a result, Anganwadi workers, or Sevikas as they are known in Maharashtra, led a huge round of protests from 2017-18, including several sit-ins and jail bharo protests. In 2019, following a nationwide announcement by the prime minister, the Maharashtra government increased their wages. This is reflected in the increase in expenditure through the ICDS General component in 2019-20.
  • District records show higher expenses from the additional state share in 2017-18, which is above what the state needs to contribute in the fund-sharing ratio. It falls drastically in 2018-19 and gradually increases in 2019-20. The additional share of the state has been considerable in 2017-18 and 2019-20.
  • A steep decline in 2020-21 points to closure of schools that year due to the Covid pandemic. As a result, expenditure on wages, electricity and water charges, office expenses, and domestic travel either fell drastically or was negligible.
     

Supplementary Nutrition Programme

Figure 6: Expenditure on Supplementary Nutrition Programme in Pune: Share of Pune in state expenditure (in %)

  • After an initial hike in 2018-19, expenditure under the Supplementary Nutrition Programme (SNP) started declining.
  • Because of growing under-nutrition from 2018-19 onwards, the Government of India had introduced a convergence of all nutrition-related schemes, including Anganwadi services, under the umbrella ICDS scheme. The schemes were merged into the National Nutrition Mission, later known as Poshan Abhiyaan.
  • Expenditure numbers for SNP underline this attention to under-nutrition in 2018-19.
  • However, the expenditure numbers of the district declined in 2019-20, and even more in 2020-21. The Government of India had issued an order to transfer SNP benefits through the Direct Benefit Transfer (DBT) mode, with effect from 1st April, 2018-19. The gradual effect of the same can be seen in the decline of the district’s SNP expenditure in 2019-20 and 2020-21.

National Nutrition Mission

Figure 7: Expenditure on National Nutrition Mission in Pune: Share of Pune in state expenditure (in %)

  • In March 2018, the government launched the National Nutrition Mission (NNM), later renamed Poshan Abhiyaan. It was a scheme to address the nutritional requirements of pregnant and lactating woman, and reflect the same in nutritional outcomes. It involved inter-sector convergence across various nutrition-oriented schemes, focus on the use of technology for real-time growth monitoring and tracking of women and children.
  • Thus, the convergence has brought about changes in the operation of the ICDS scheme, as new initiatives targeting objectives under NNM were introduced.
  • NNM expenditure was the biggest component of the scheme in 2019-20. The reason for this could be higher availability of funds that year, when allocation was increased to Rs 3,400 crore, from Rs 3,061 crore in 2018-19.

Anganwadi services

Figure 8: Expenditure on Anganwadi services in Pune: Share of Pune in state expenditure (in %)

  • Anganwadi services expenditure includes salaries paid to functionaries at the district and project level, expenses on drinking water facilities, and construction of toilets in anganwadi centres. Therefore, expenditure under this component determines the condition of physical infrastructure and its maintenance.
  • Restructuring of the scheme, initiated in 2018-19, has categorised salary expenditure under Anganwadi services instead of the erstwhile ICDS General, leading to a sudden hike under this head in 2019-20 and 2020-21.

Anganwadi construction

Figure 9: Expenditure on Anganwadi construction by the district: Share of Pune in state expenditure (in %)

  • Plan grants are made as a part of a proposal to achieve a specific objective. Construction of Anganwadi centres is also taken up under plan grants. Funds spent by the district on such construction mostly increased between 2017-18 and 2020-21. The records of functional Anganwadi centres have also increased accordingly—10 centres were added in 2020-21.

Zilla Parishad

Figure 10: Expenditure on Zilla Parishad by the district: Share of Pune in state expenditure (in %)

  • Establishment grants are given to the Zilla Parishad to account for salaries and allowances of employees that it appoints with the approval of the state government for the concerned development schemes.
  • This head accounts for a major share of expenses under ICDS. Over the years, the expenditure increased until 2020-21.

05.

How did the district perform given the physical infrastructure available?

Section titled How did the district perform given the physical infrastructure available?

Figure 11: Share of beneficiaries, AWWs and AWHs, and AWCs in the state’s total (%)

Table 1: Ratio of AWWs and AWHs to beneficiaries

  • Pune caters to a higher share of beneficiaries compared to the proportion of AWCs in the district and AWWs and AWCs based in them.
  • The ratio of AWWs and AWHs to beneficiaries was 1:39 in 2019-20, and 1:41 in 2020-21 (Table 1).

06.

How were funds for the scheme distributed among all components over the four years under review?

Section titled How were funds for the scheme distributed among all components over the four years under review?

Figure 12: Component-wise distribution of Funds in Pune under ICDS

  • The Supplementary Nutrition Programme consumed the maximum share of the district’s ICDS expenditure for all the years under review except 2020-21.
  • SNP expenditure fell in 2019-20 and dropped further in 2020-21. From 2019-20, it was provided through DBT, directly reaching beneficiaries through bank accounts, and was thus not reflected in district expenditure records.
  • The pandemic in 2020-21 had strengthened DBT due to the inaccessibility of physical infrastructure, making this dip in the district expenditure more prominent.

07.

What initiatives has Maharashtra taken for ICDS?

Section titled What initiatives has Maharashtra taken for ICDS?

Maharashtra, as a state, is attentive to the importance of nutrition. This is reflected in its various initiatives, one of which is Bhaubeej bhet—a bonus given to Anganwadi workers during a widely celebrated regional festival in Maharashtra. It has been given regularly for all years from 2017-18 to 2020-21.

Figure 13: Expenditure on Bhaubeej Bhet (Rs lakhs) in Maharashtra

The district also incurred expenditure on initiatives such as Village Child Development Centres (VCDC) in 2018-19. This is again an initiative of the government of Maharashtra to address nutritional requirements of children in non-tribal regions of the state. Its goal is to strengthen home-based management of children with Severe Acute Malnutrition (SAM).

08.

Where does the district stand on information available on ICDS?

Section titled Where does the district stand on information available on ICDS?

Given the importance of ICDS in providing nutrition and helping in the overall development of children, different data/information about the scheme should be readily available to and accessible by the common masses.

The following table shows a list of essential data points/information regarding ICDS that various stakeholders will find useful. The availability and accessibility of this information is critical to ensure the scheme’s success. The current level of information available has been evaluated for each of the indicators.

Transparency and Accountability Index

Availability

Is the data is available at the district level?

Fiscal (input) indicators: Yes, on the district treasury website. It is available for various ICDS components such as Supplementary Nutrition Programme, ICDS General, National Nutrition Mission. It is available for the following fiscal indicators: net expenditure and gross expenditure.

Outcome indicators: Yes. It is available online for nutrition-specific indicators such as stunting, wasting, anaemia among children, etc, from the National Family Health Survey.

Is the data available via online/offline mode?

Fiscal (input) indicators: Online

Outcome indicators: Online

Accessibility

Is the data available in an 'open access' format?

Fiscal (input) indicators: Yes

Outcome indicators: Yes

Is the data published in machine-readable formats, such as CSV, Excel etc., and is it easily reusable?

Fiscal (input) indicators: Yes

Outcome indicators: Data is available in PDF format.

Is the data published in multiple languages?

Fiscal (input) indicators: No, English only

Outcome indicators: No, English only

Completeness/Comprehensiveness  

Is the data complete or partial?

Fiscal (input) indicators: Partial. Comprehensive data on the scheme is not available. Only component-wise information is available.

Outcome indicators: Yes, information is available on indicators such as the number of AWCs, AWWs, AWHs and CDPOs in the Monthly Progress Reports.

Timeliness of Data that is available

Is the data generated on a timely and regular basis?

Fiscal (input) indicators: Yes

Outcome indicators: Yes

How frequently is the data updated?

Fiscal (input) indicators: Monthly

Outcome indicators: NFHS data is available at different intervals each time. The latest survey was conducted after an interval of three years.

Which year does the latest data cover?

Fiscal (input) indicators: 2022-23 (until December)

Outcome indicators: For NFHS, data is available up to 2019-20.

User-friendliness and relevance of data that is available 

Is the data easy to understand and comprehend and are the analytics published online? (Is it free of technical codes and difficult terminology?)

Fiscal (input) indicators: Access to DDO Codes is required to gather the data.

Outcome indicators: Yes, the analytics produced by NFHS are easy to comprehend. Information on physical indicators from the Monthly Progress Report is also easily comprehensible.

Public participation and accountability  

Is there space for people to participate in planning/budgeting/monitoring/evaluation/auditing of the scheme at the district/block/panchayat level?

No

Are people physically present and actively involved in the consultations/meetings in any of the above tiers of programme design and implementation?

No

If there is no possibility of physical participation, are there other 'means' of participation?

No

Is there any provision for a social audit of the scheme?

No

Are social audits conducted as per norms?

No

Are social audit reports publicly available?

No

Is there any grievance redressal mechanism for beneficiaries?

Toll free number 14408.

  • Nutritional parameters covered under ICDS that deal with better outcomes of child health, adolescent girls and pregnant women showed a declining trend in Pune. The district trails the state on stunting, wasting and under-nutrition. The increase in stunting in Pune has been greater than the increase in the state. Incidence of anaemia among adolescent girls and pregnant women has also increased in the district.
  • Component-wise expenditure under the scheme shows a decline from 2017-18 to 2020-21. Fund allocation in ICDS General, SNP, National Nutrition Mission and Anganwadi services shows an inconsistent trend in fund allocation. Fund establishment grants are given to the Zilla Parishad for salaries and allowances of employees in the district.
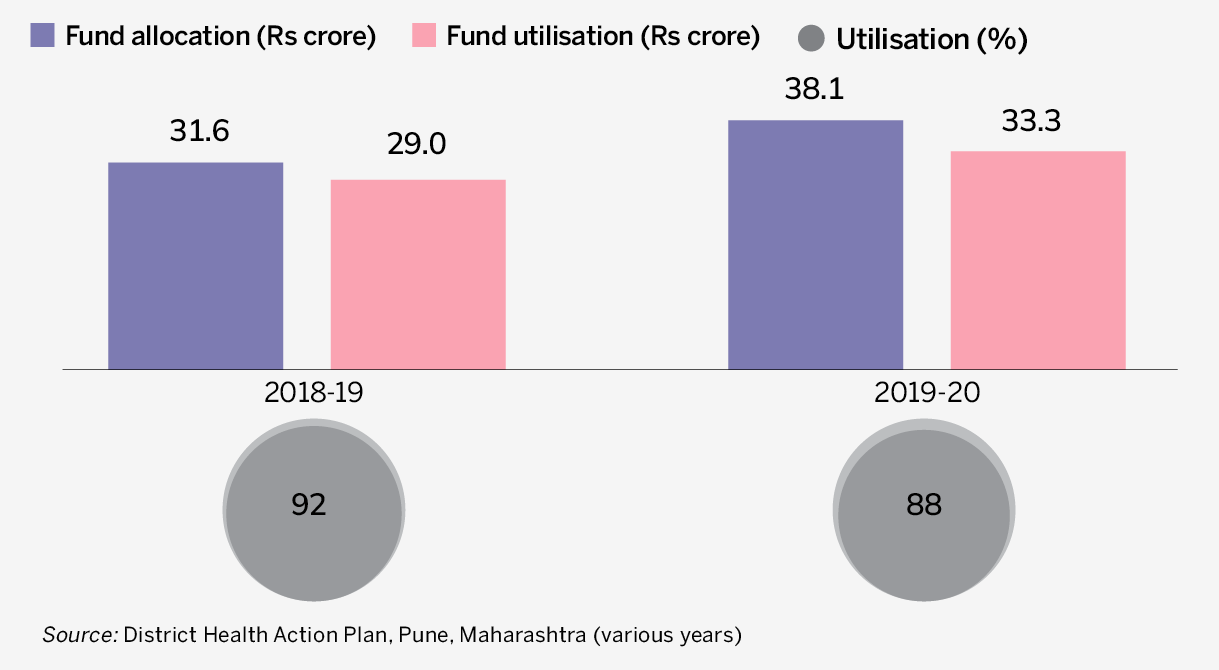
  • Although ICDS, by nature, has well-defined beneficiaries and unit-cost, the extent of fund utilisation is always high because the fund allocation is known prior to spending. But in the case of Pune, the extent of fund utilisation has not achieved the benchmark over the years from 2017-18 to 2020-21, which demands attention.
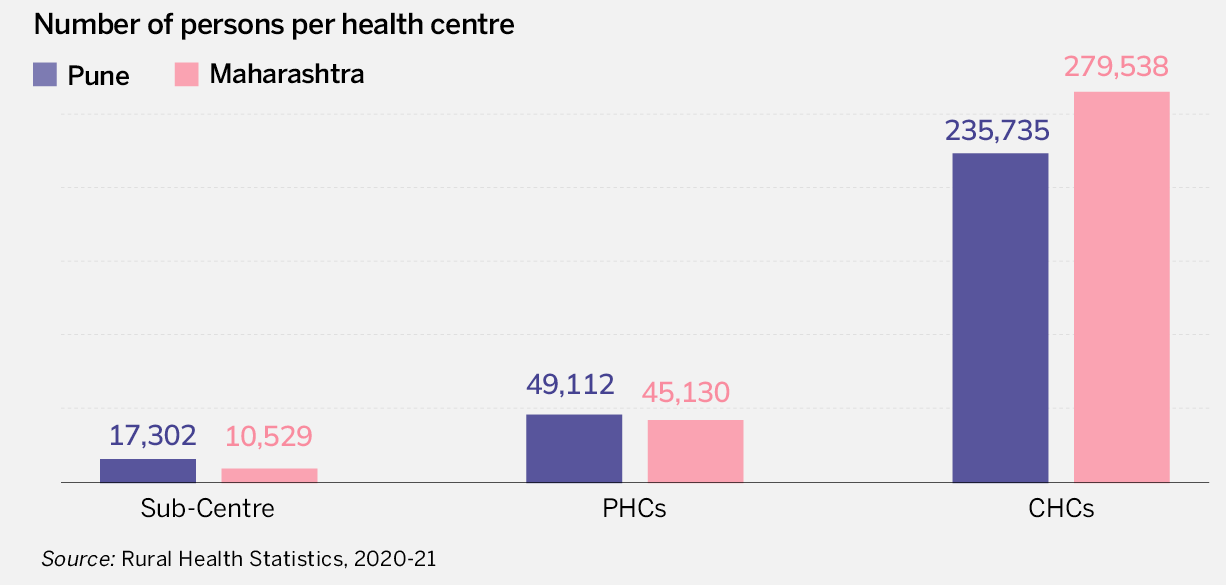
  • The shortage of infrastructure, human resources, tech-savvy staff and capacity issues across departments at every tier of the government has huge implications on fund utilisation, which is reflected in nutritional outcomes of the district.

CREDITS

Author: Tushar Kapoor, Swarupa Das, Amita

Series Edited by: Nilachala Acharya, Subrat Das

Editorial Inputs: Suraj Prasad Jaiswal, Mitali Gupta, Ujala Kumari

Designed by: Flying Saints

Graphics by: How India Lives

Back to Top