Skip to content
-

Gajapati (Odisha)

Mahatma Gandhi National Rural Employment Guarantee Scheme (MGNREGS)

This factsheet presents an analysis of the performance of the ‘Mahatma Gandhi National Rural Employment Guarantee Scheme’ (MGNREGS) for the district of Gajapati (Odisha).

Gajapati district is located in the south-east region of Odisha. It got the status of a district in 1992 after bifurcation from Ganjam district. It consists of 7 blocks. Read more about Gajapati.

MGNREGS aims to provide minimum 100 days of wage employment per rural household in a financial year. It was launched in 2005 with the goal of enhancing livelihood security of India’s rural masses. Read more about MGNREGS.

01.

How Much Funds Were Made Available and How Much Was Spent?

Section titled How Much Funds Were Made Available and How Much Was Spent?

Funds are made available to districts based on employment demand and the need for material. Figure 1 presents the trend of fund available and the expenditure incurred under MGNREGS in Gajapati.

Figure 1: Fund Available and Expenditure (Rs Crore)
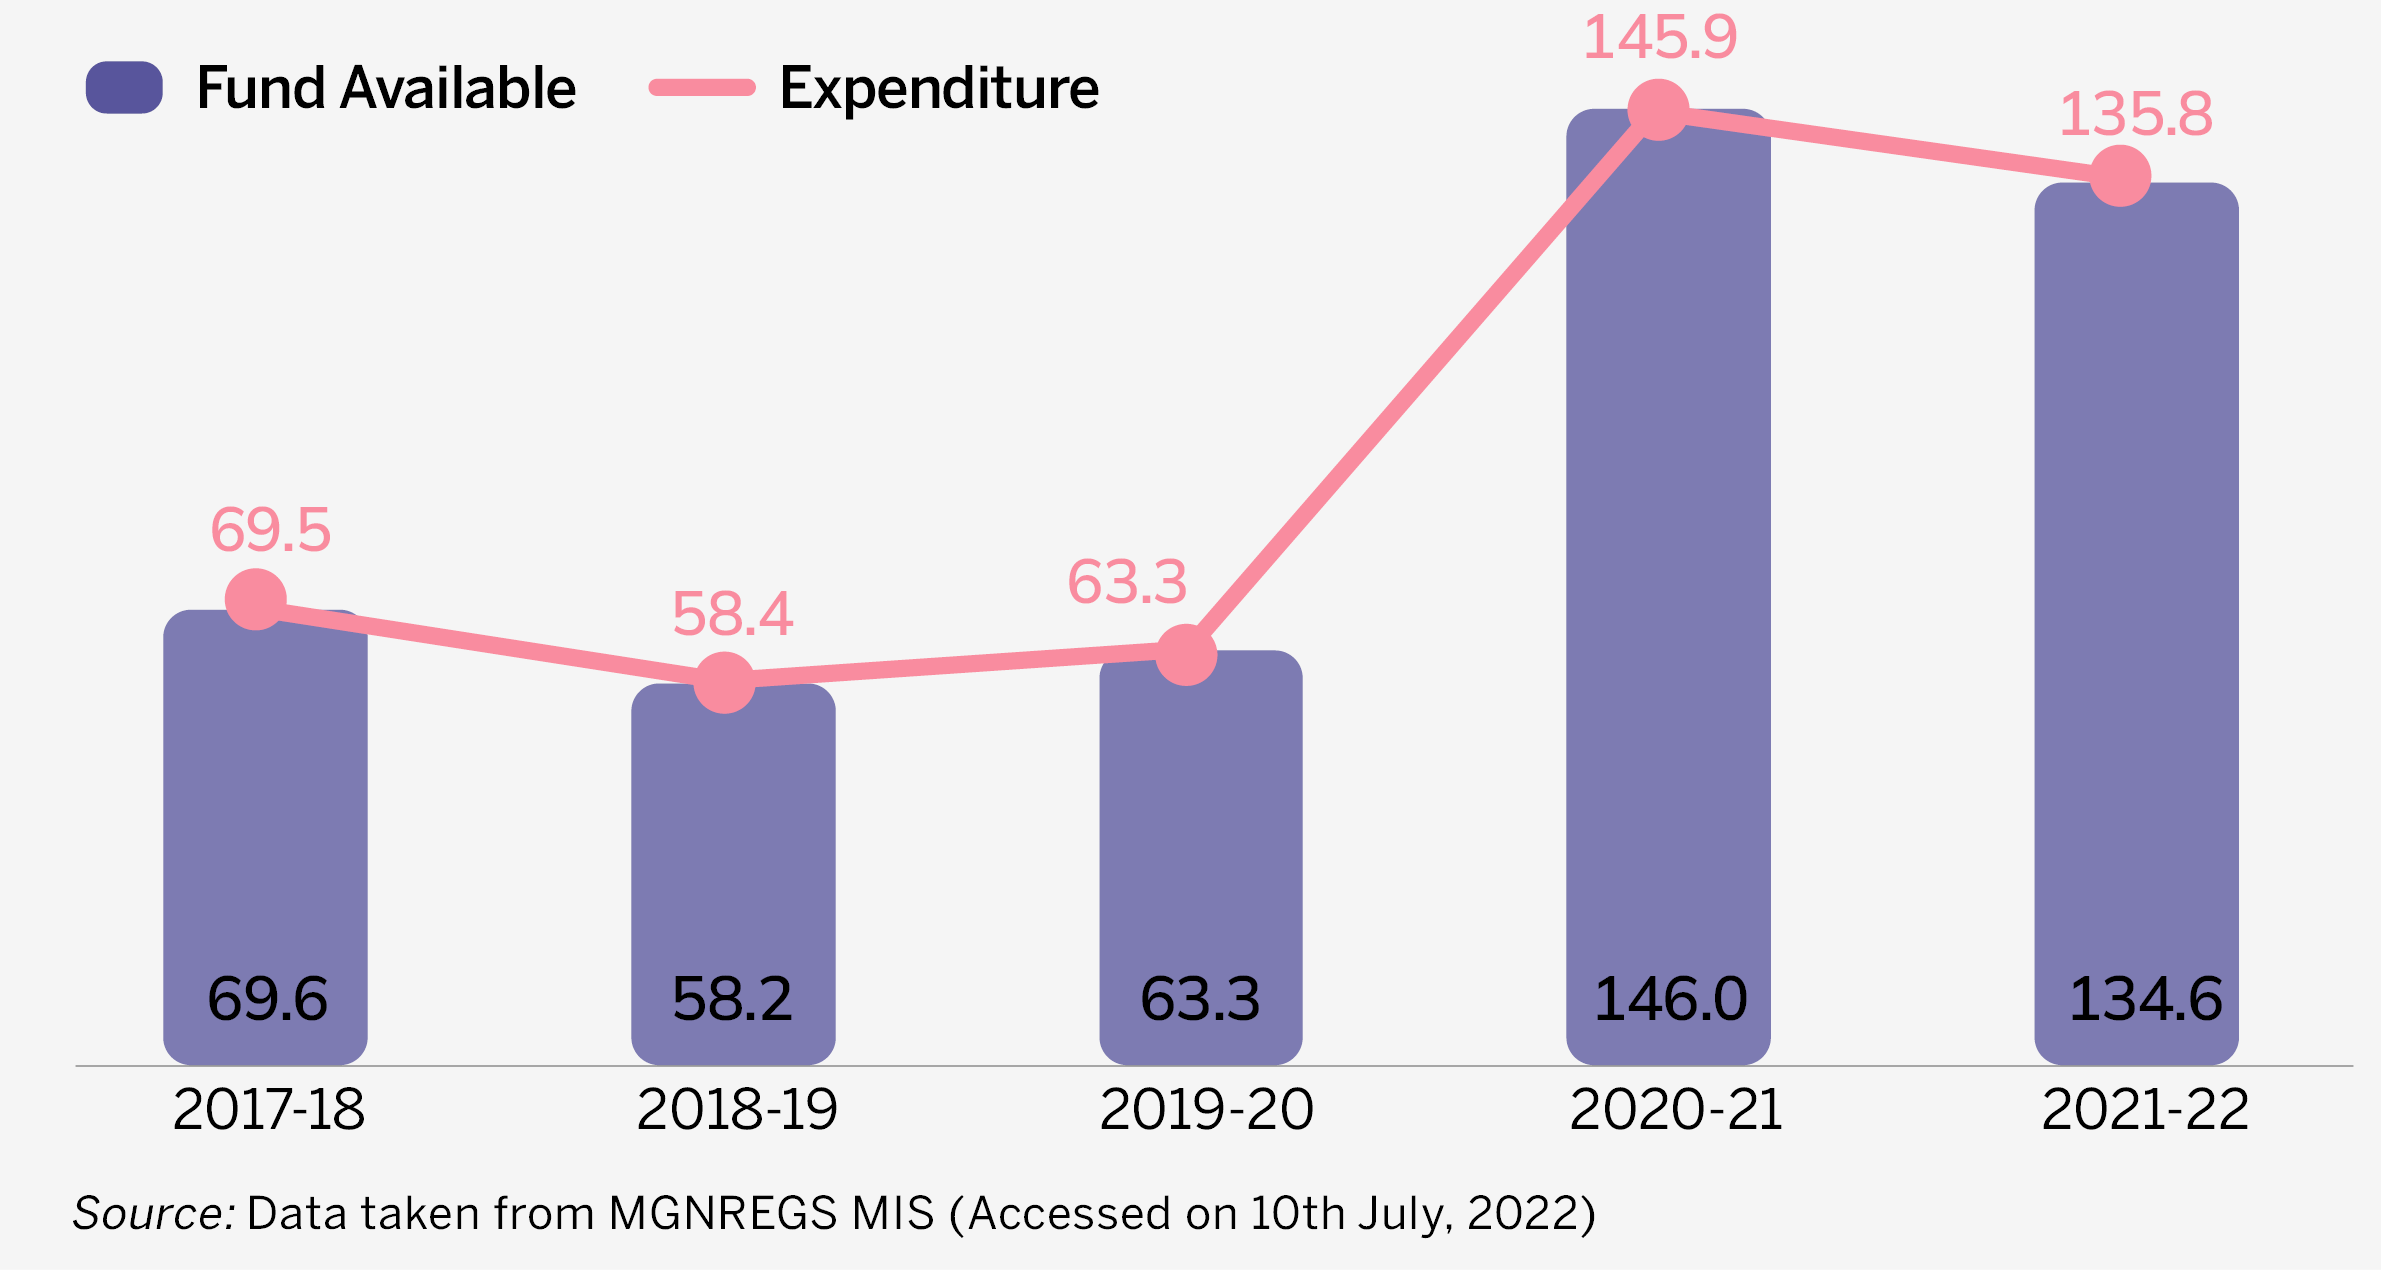
  • Between 2017-18 and 2019-20, total funds available and total expenditure saw marginal changes.
  • In 2020-21, both funds available and expenditure more than doubled compared to 2019-20, reflecting the increased demand for work in the backdrop of the COVID-19 induced economic slowdown.
  • In 2021-22, the second year of the pandemic, both fund availability and expenditure fell by 8% and 7%, respectively.

Figure 2 shows the sum of funds available and expenditure for the years between 2017-18 and 2021-22 in Gajapati’s seven blocks.

Figure 2: Cumulative Fund Available and Expenditure Between 2017-18 and 2021-22 (Rs Crore)
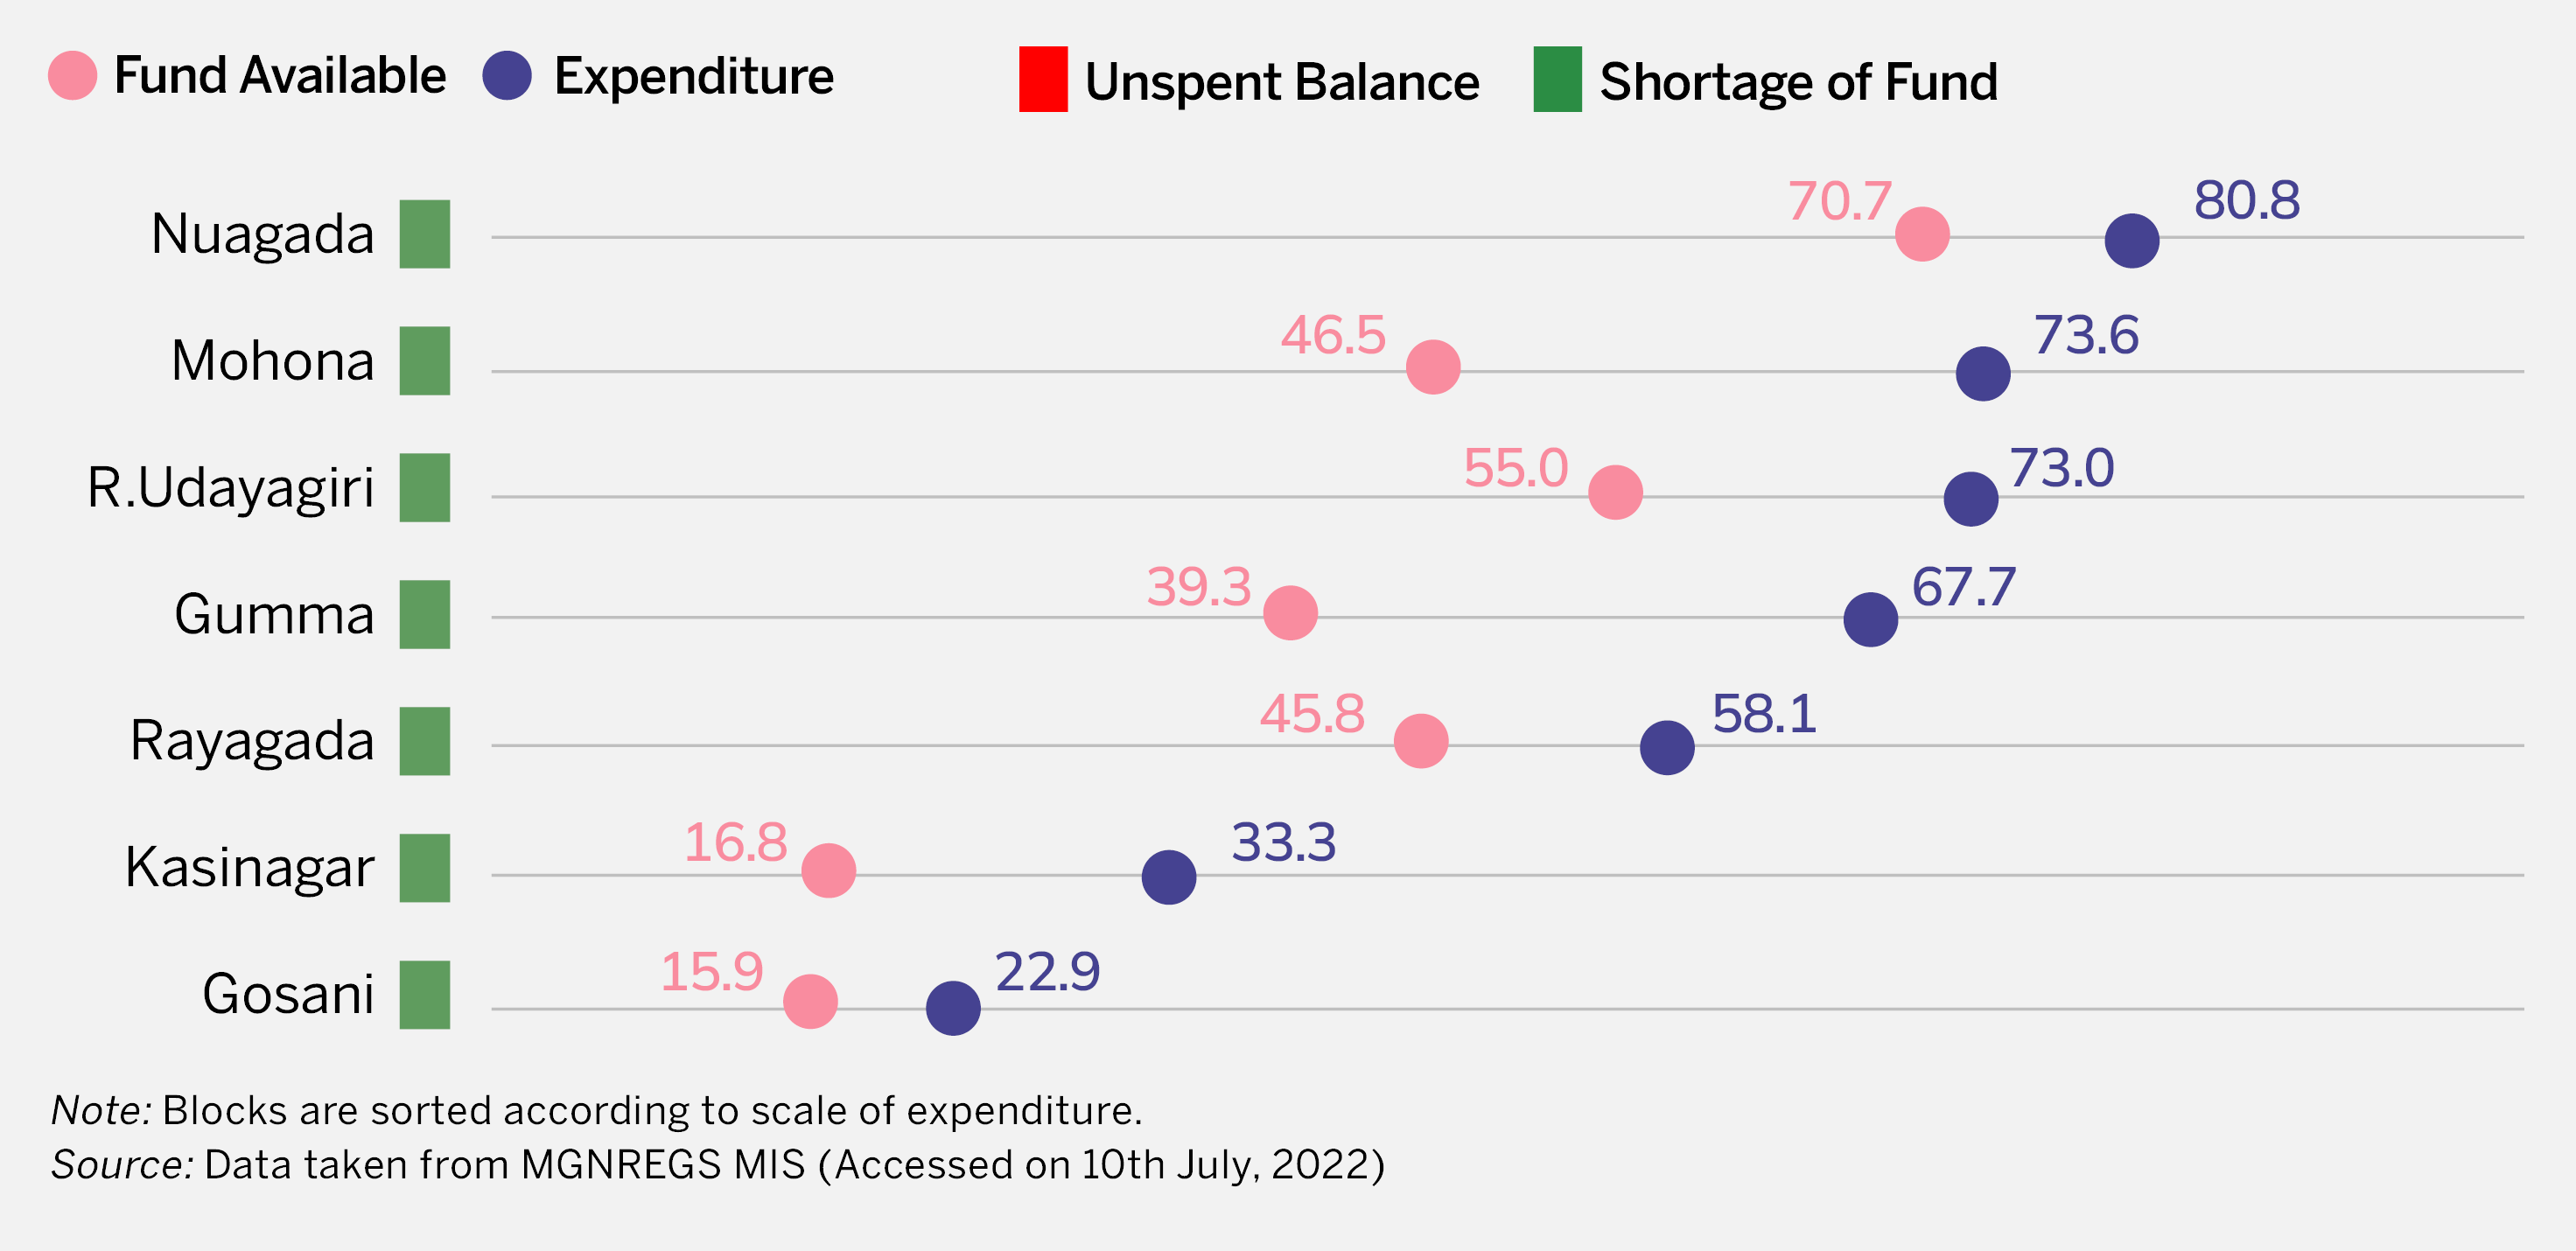
  • The largest amount of funds available and expenditure in this period have been in Mohona and Nuagada, while the lowest has been in Gosani and Kasinagar.
  • Between 2017-18 and 2021-22, cumulative expenditure exceeded cumulative funds available in all seven blocks.
02.

How Has the Fund Utilisation Been?

Section titled How Has the Fund Utilisation Been?

Of the total funds available with a district, some amount can remain unspent at the end of a financial year for various reasons. Or, in other cases, expenditure can exceed funds available, which indicates a shortage of funds. The extent of funds spent out of the total funds available is called the ‘rate of utilisation’. 
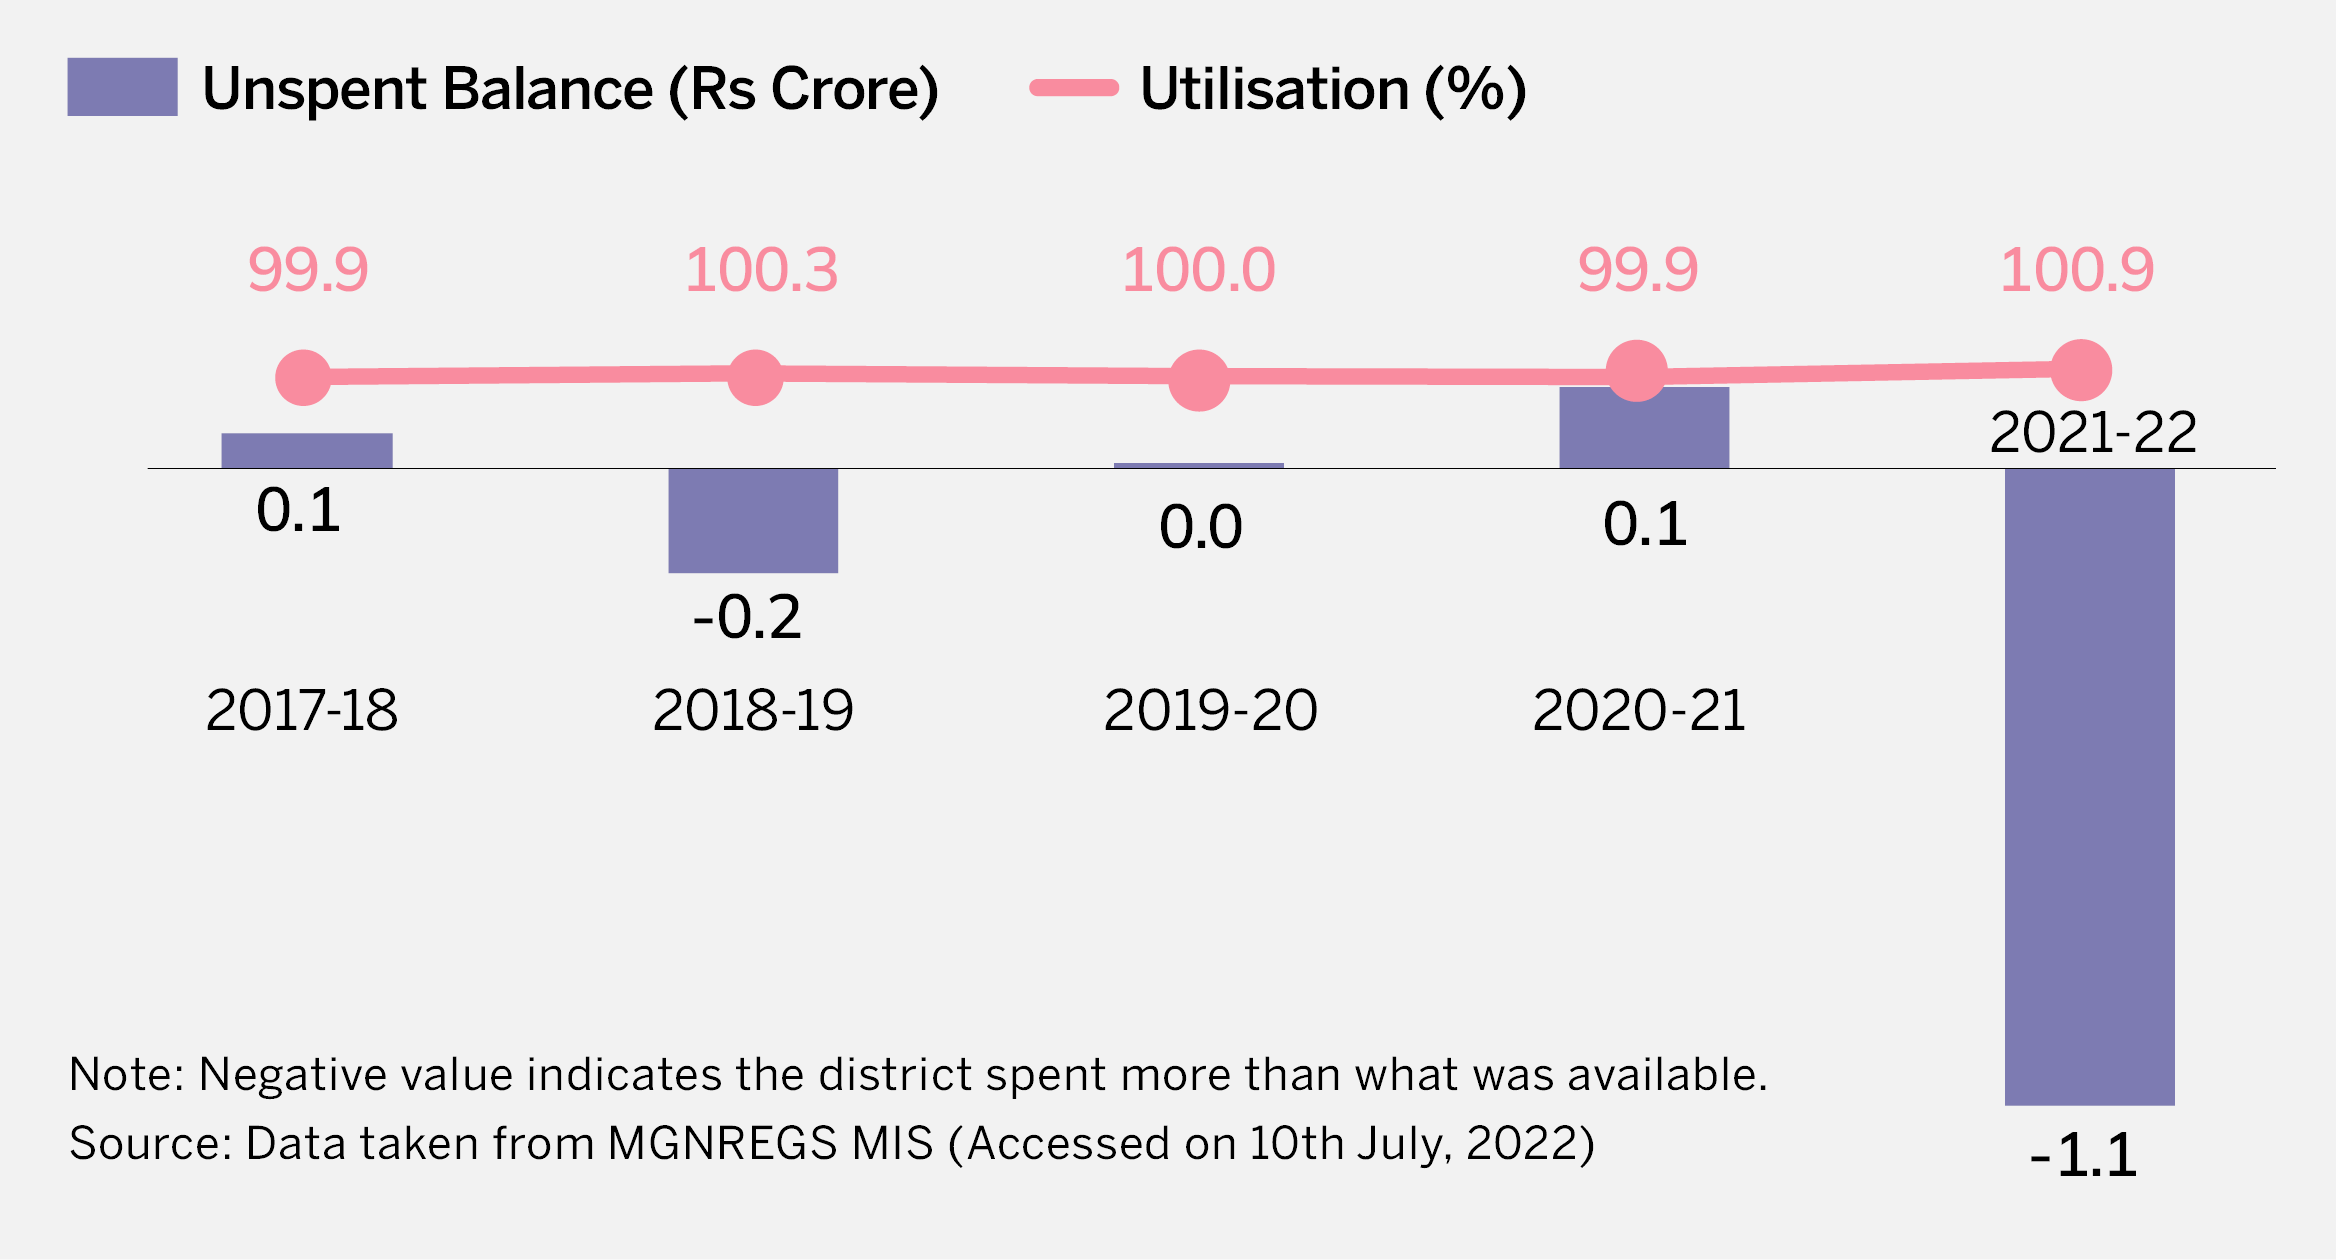
Figure 3 shows out of the total funds available with the district, how much was unspent at the end of the financial year, and its annual rate of utilisation.

Figure 3: Unspent Balance and Rate of Utilisation

  • Gajapati had an unspent balance in 2019-20, as well as in 2020-21, the first year of the pandemic when demand for work increased substantially. In 2021-22, however, it saw a shortage of funds.
  • Barring 2021-22, the utilisation rate has been very close to 100%.

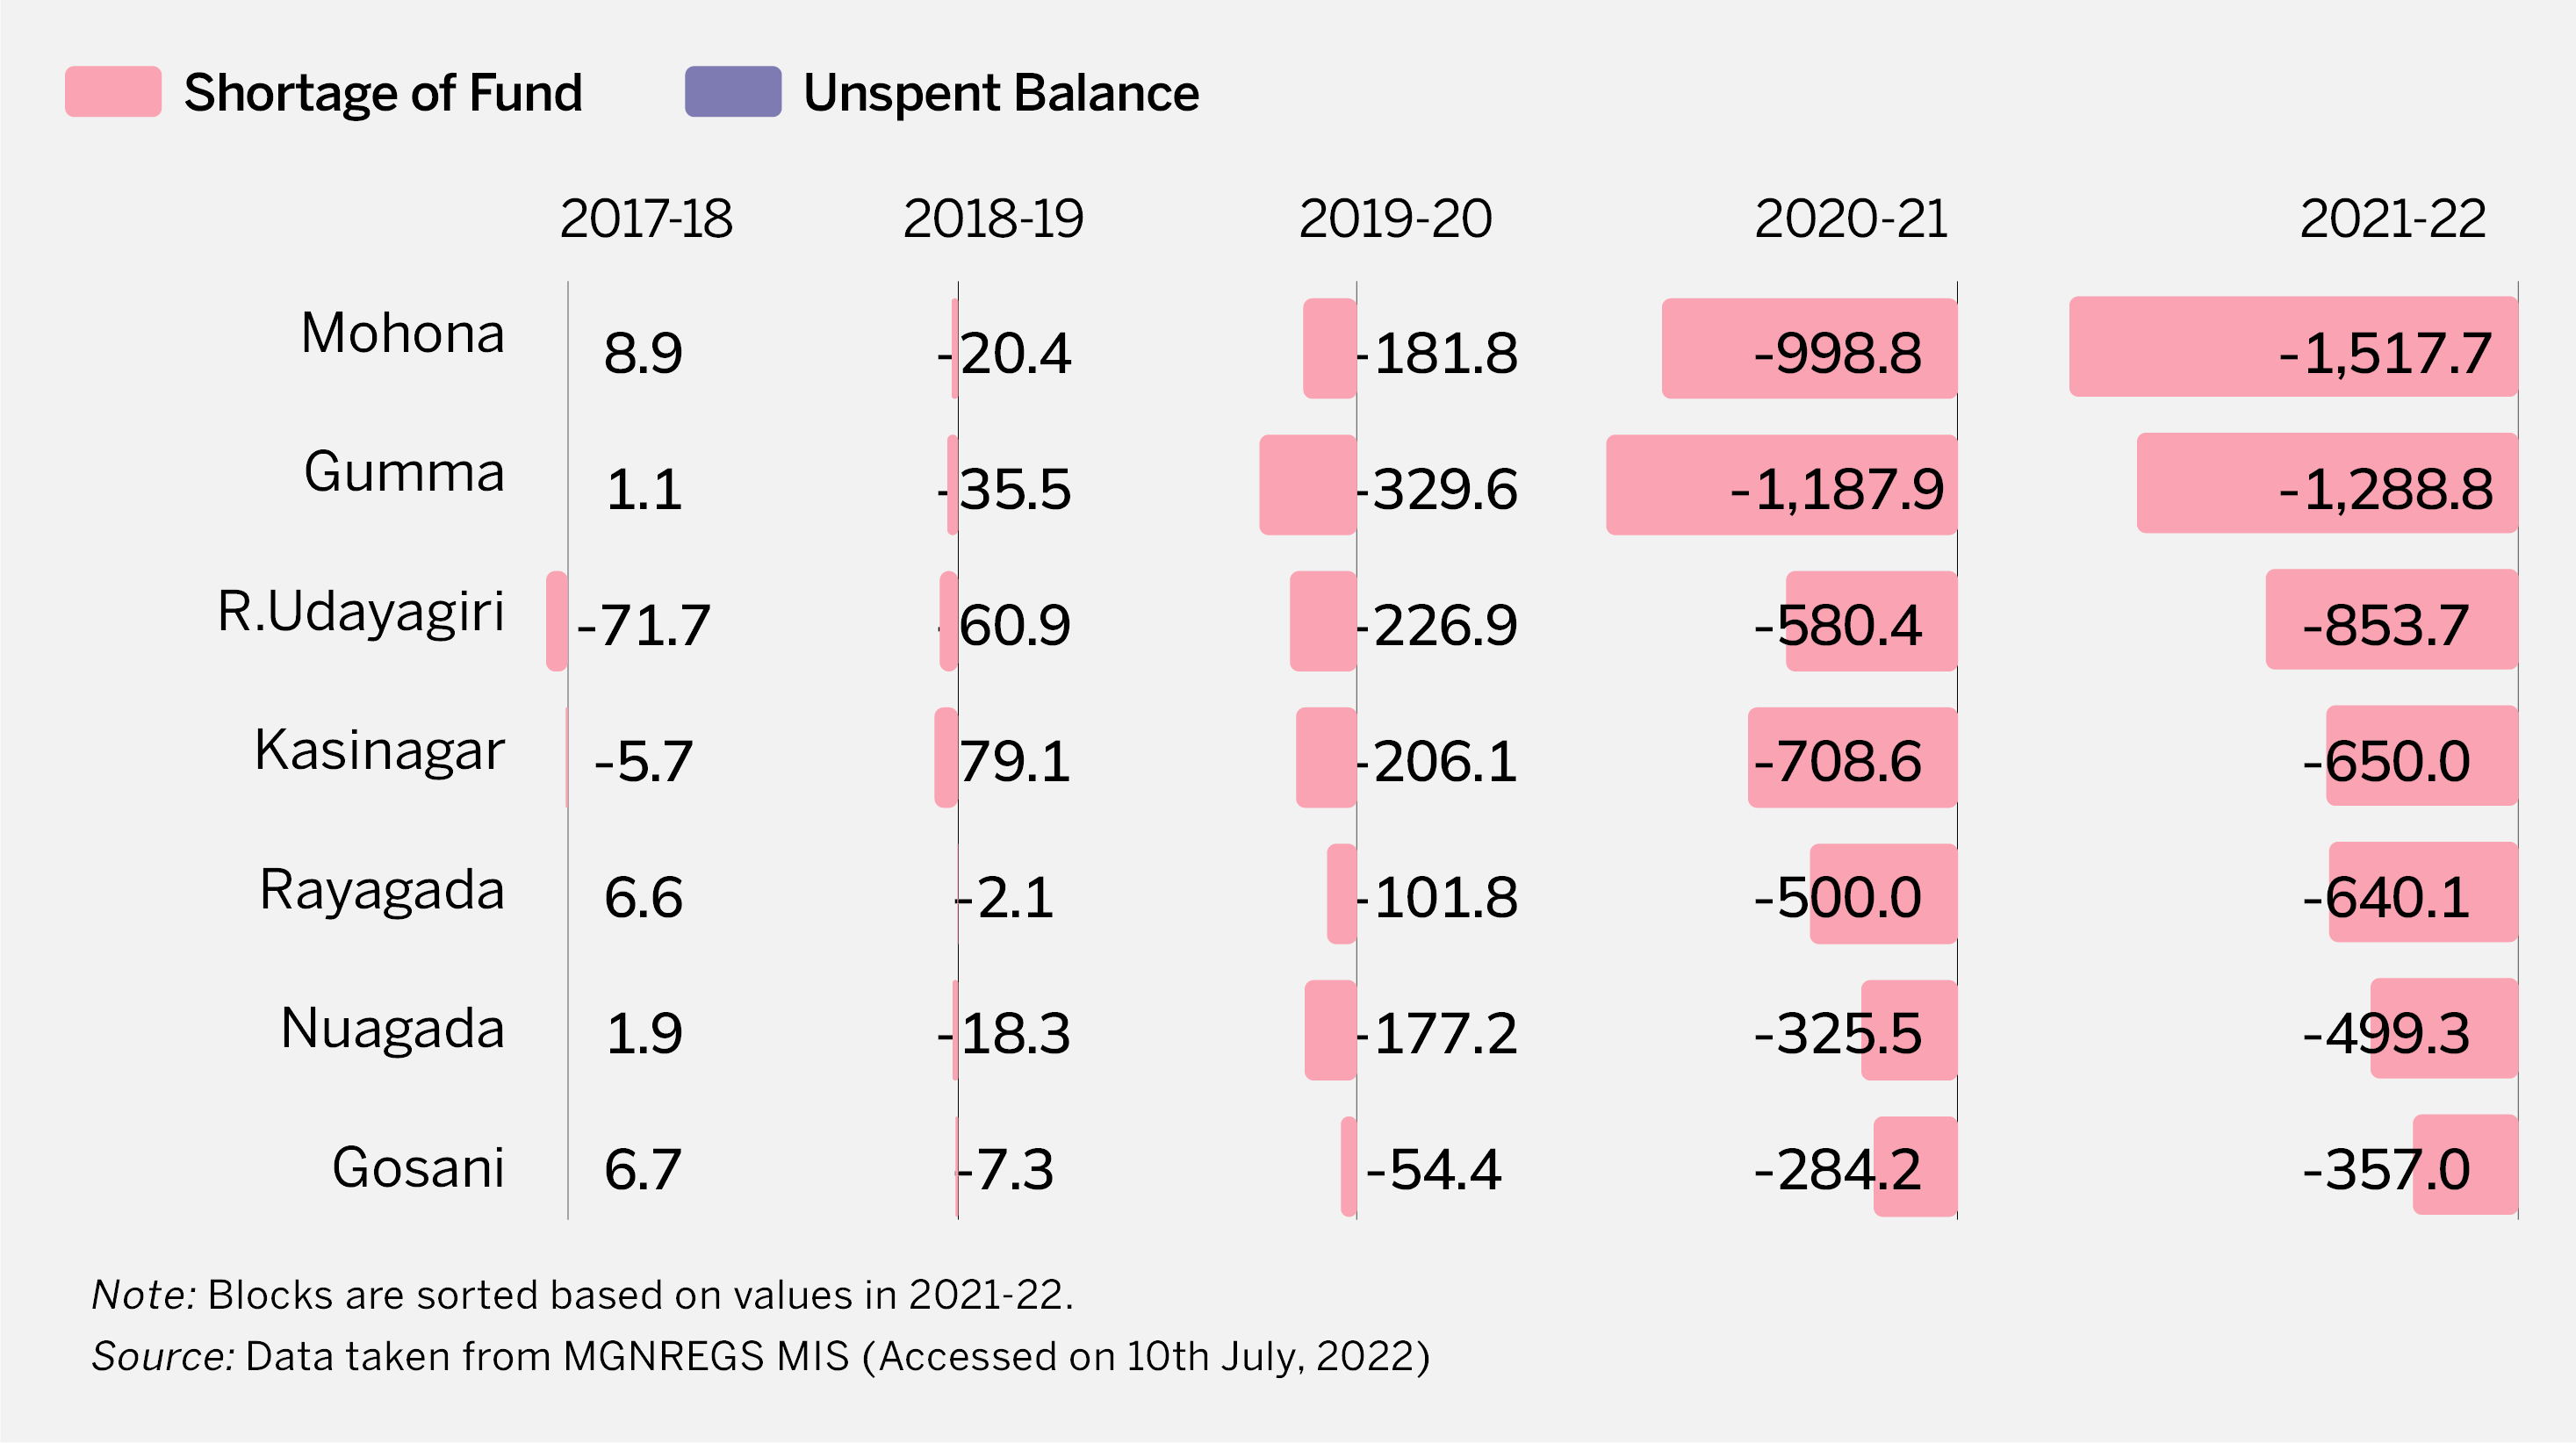
Figure 4: Unspent Balance/ Fund Shortage in Blocks (Rs lakh)

  • At the district level, funds fell short in two of the five years. At the block level, all seven blocks reported a shortage of funds in each of the last four years.
  • The shortage of funds has increased in the last two years, and was Rs 46 crore and Rs 58 crore in 2020-21 and 2021-22, respectively.
  • At the end of 2021-22, the aggregate fund shortage at the block level was Rs 58 crore, while the district had a shortage of Rs 1.1 crore. This is because there was a surplus/unspent balance of Rs 47 crore with the ‘district level line department’ and ‘District Programme Coordinator (DPC)’.
  • At the end of 2021-22, Mohona and Gumma blocks had the largest shortage of funds.

03.

Where is the Money Going?

Section titled Where is the Money Going?

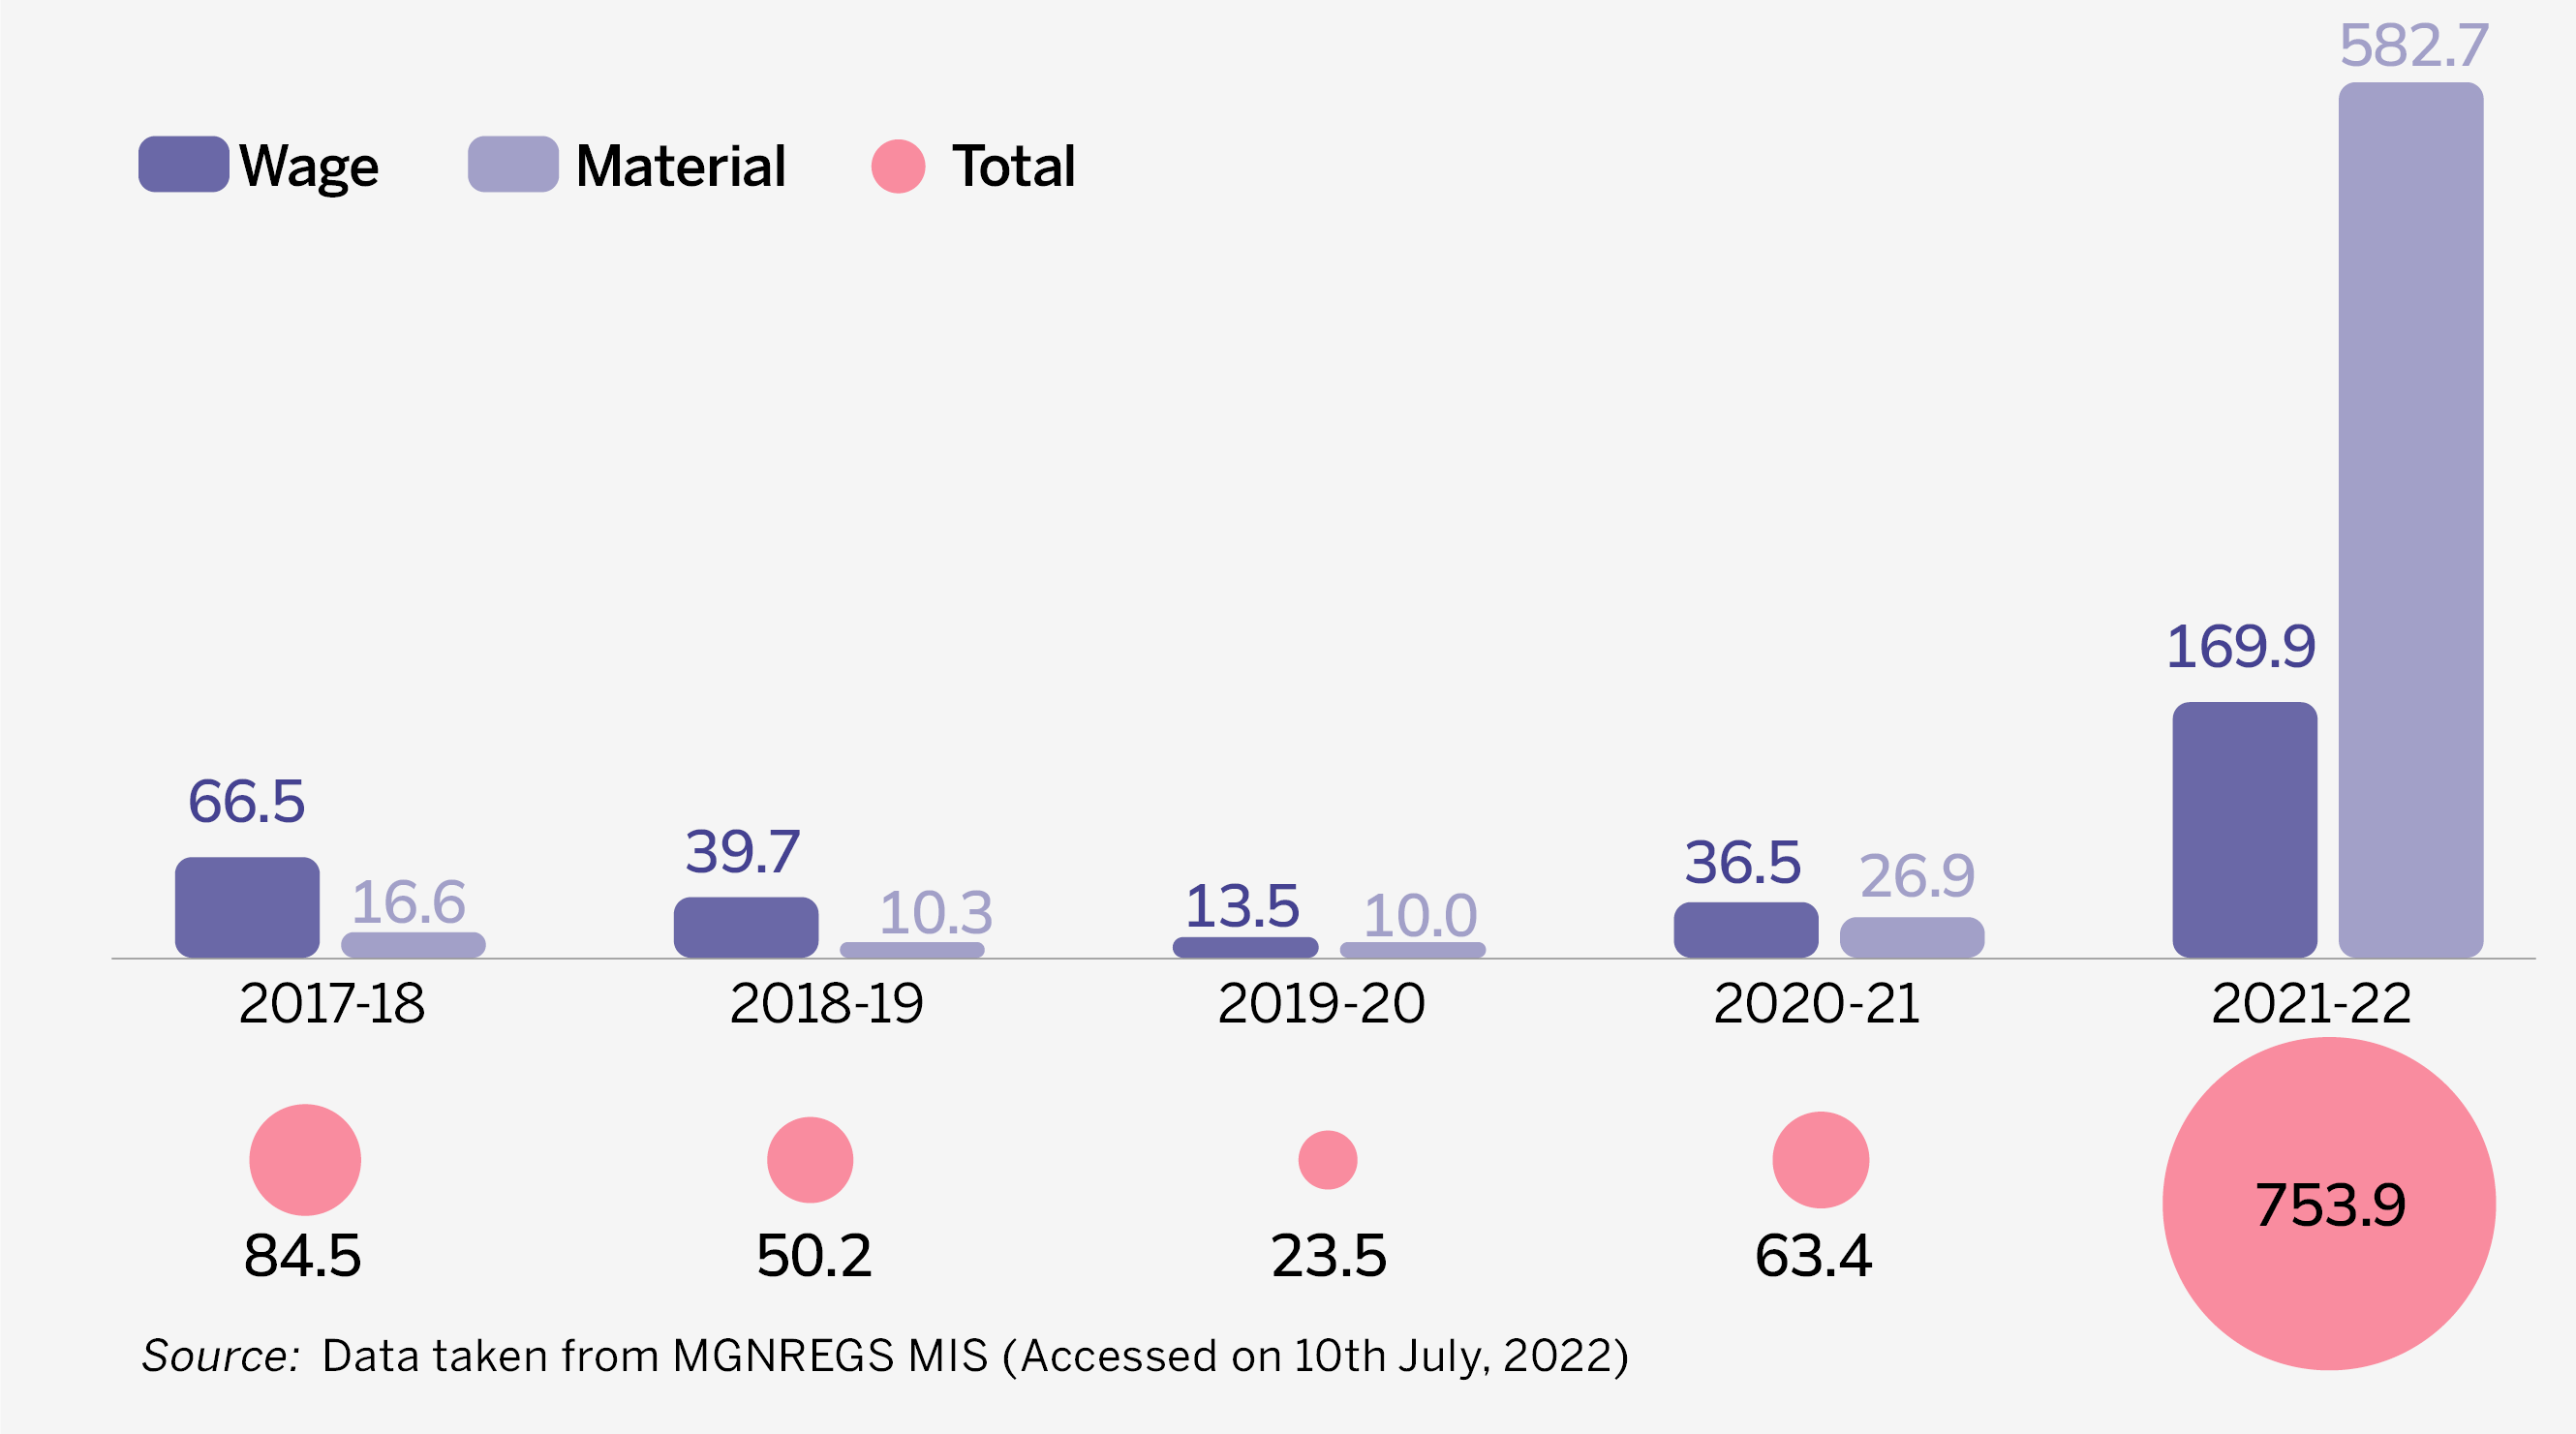
Total expenditure under MGNREGS occurs on four components: wages, material, taxes paid on buying materials, and lastly the administration. The last two are small components. Hence, only wages and material expenses have been analysed below.

Figure 5: Components of Expenditure

  • In 2020-21, the total expenditure increased by Rs 83 crore. Of this, Rs 64 crore went towards wages and Rs 18 crore towards material.
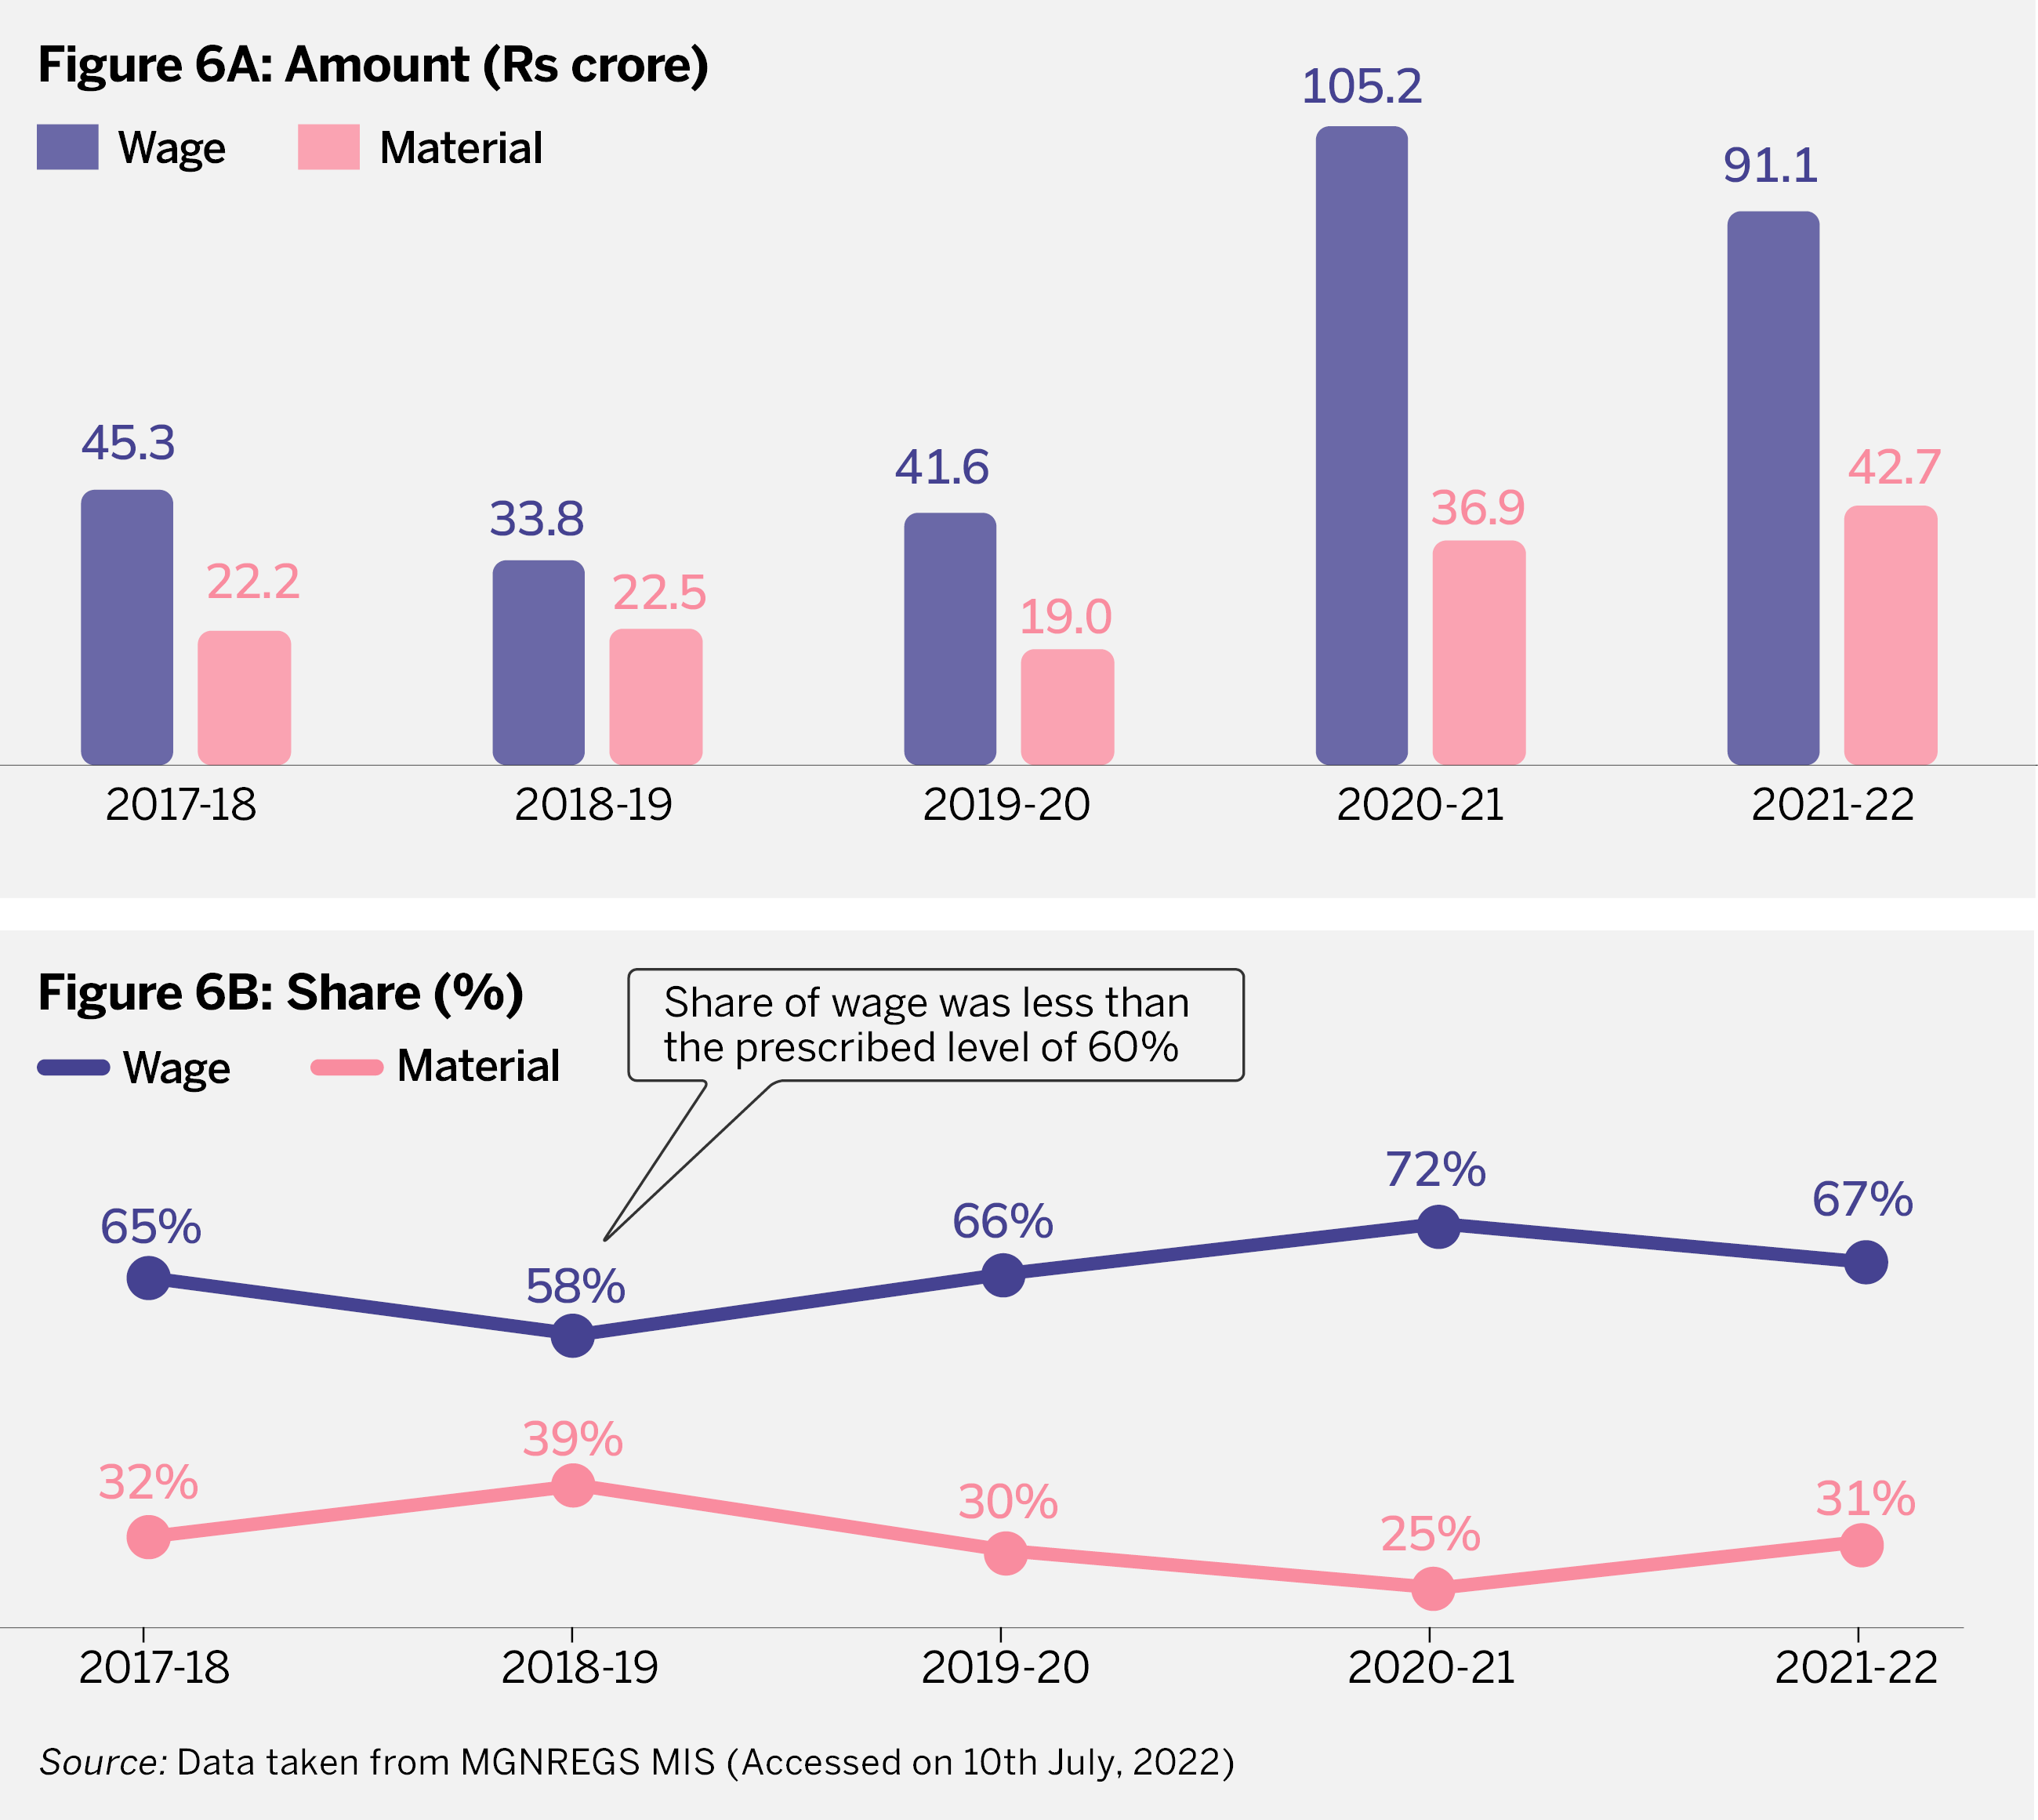
  • In 2018-19, the share of wage bill was below the prescribed level of 60%.
  • The other two components (taxes and administration expenses) are in the range of a combined Rs 2-4 crore in this period.

04.

What is the Scale of Payment Due?

Section titled What is the Scale of Payment Due?

Sometimes, either because of excess expenditure over funds available or because of procedural delays, payment for the work done can be due at the end of the period. This amount is called ‘payment due’. This amount is generally paid in the subsequent period. Figure 6 shows the trend of total payment due and its breakup across two major components, wages and material.

Figure 6: Total Payment Due (Rs Lakh)

  • Between 2018-19 and 2020-21, payment due changed very little, and were below 1% of the total expenditure.
  • However, in 2021-22, payment due increased to Rs 7.5 crore, from Rs 63 lakh in 2020-21.
  • Most of this increase in payment due was on account of material expenses.
  • At the end of 2021-22, Mohona (Rs. 2.2 crore) and Nuagada (Rs 1.7 crore) had the highest payment due.

05.

How Many Demanded Work and How Many Were Offered?

Section titled How Many Demanded Work and How Many Were Offered?

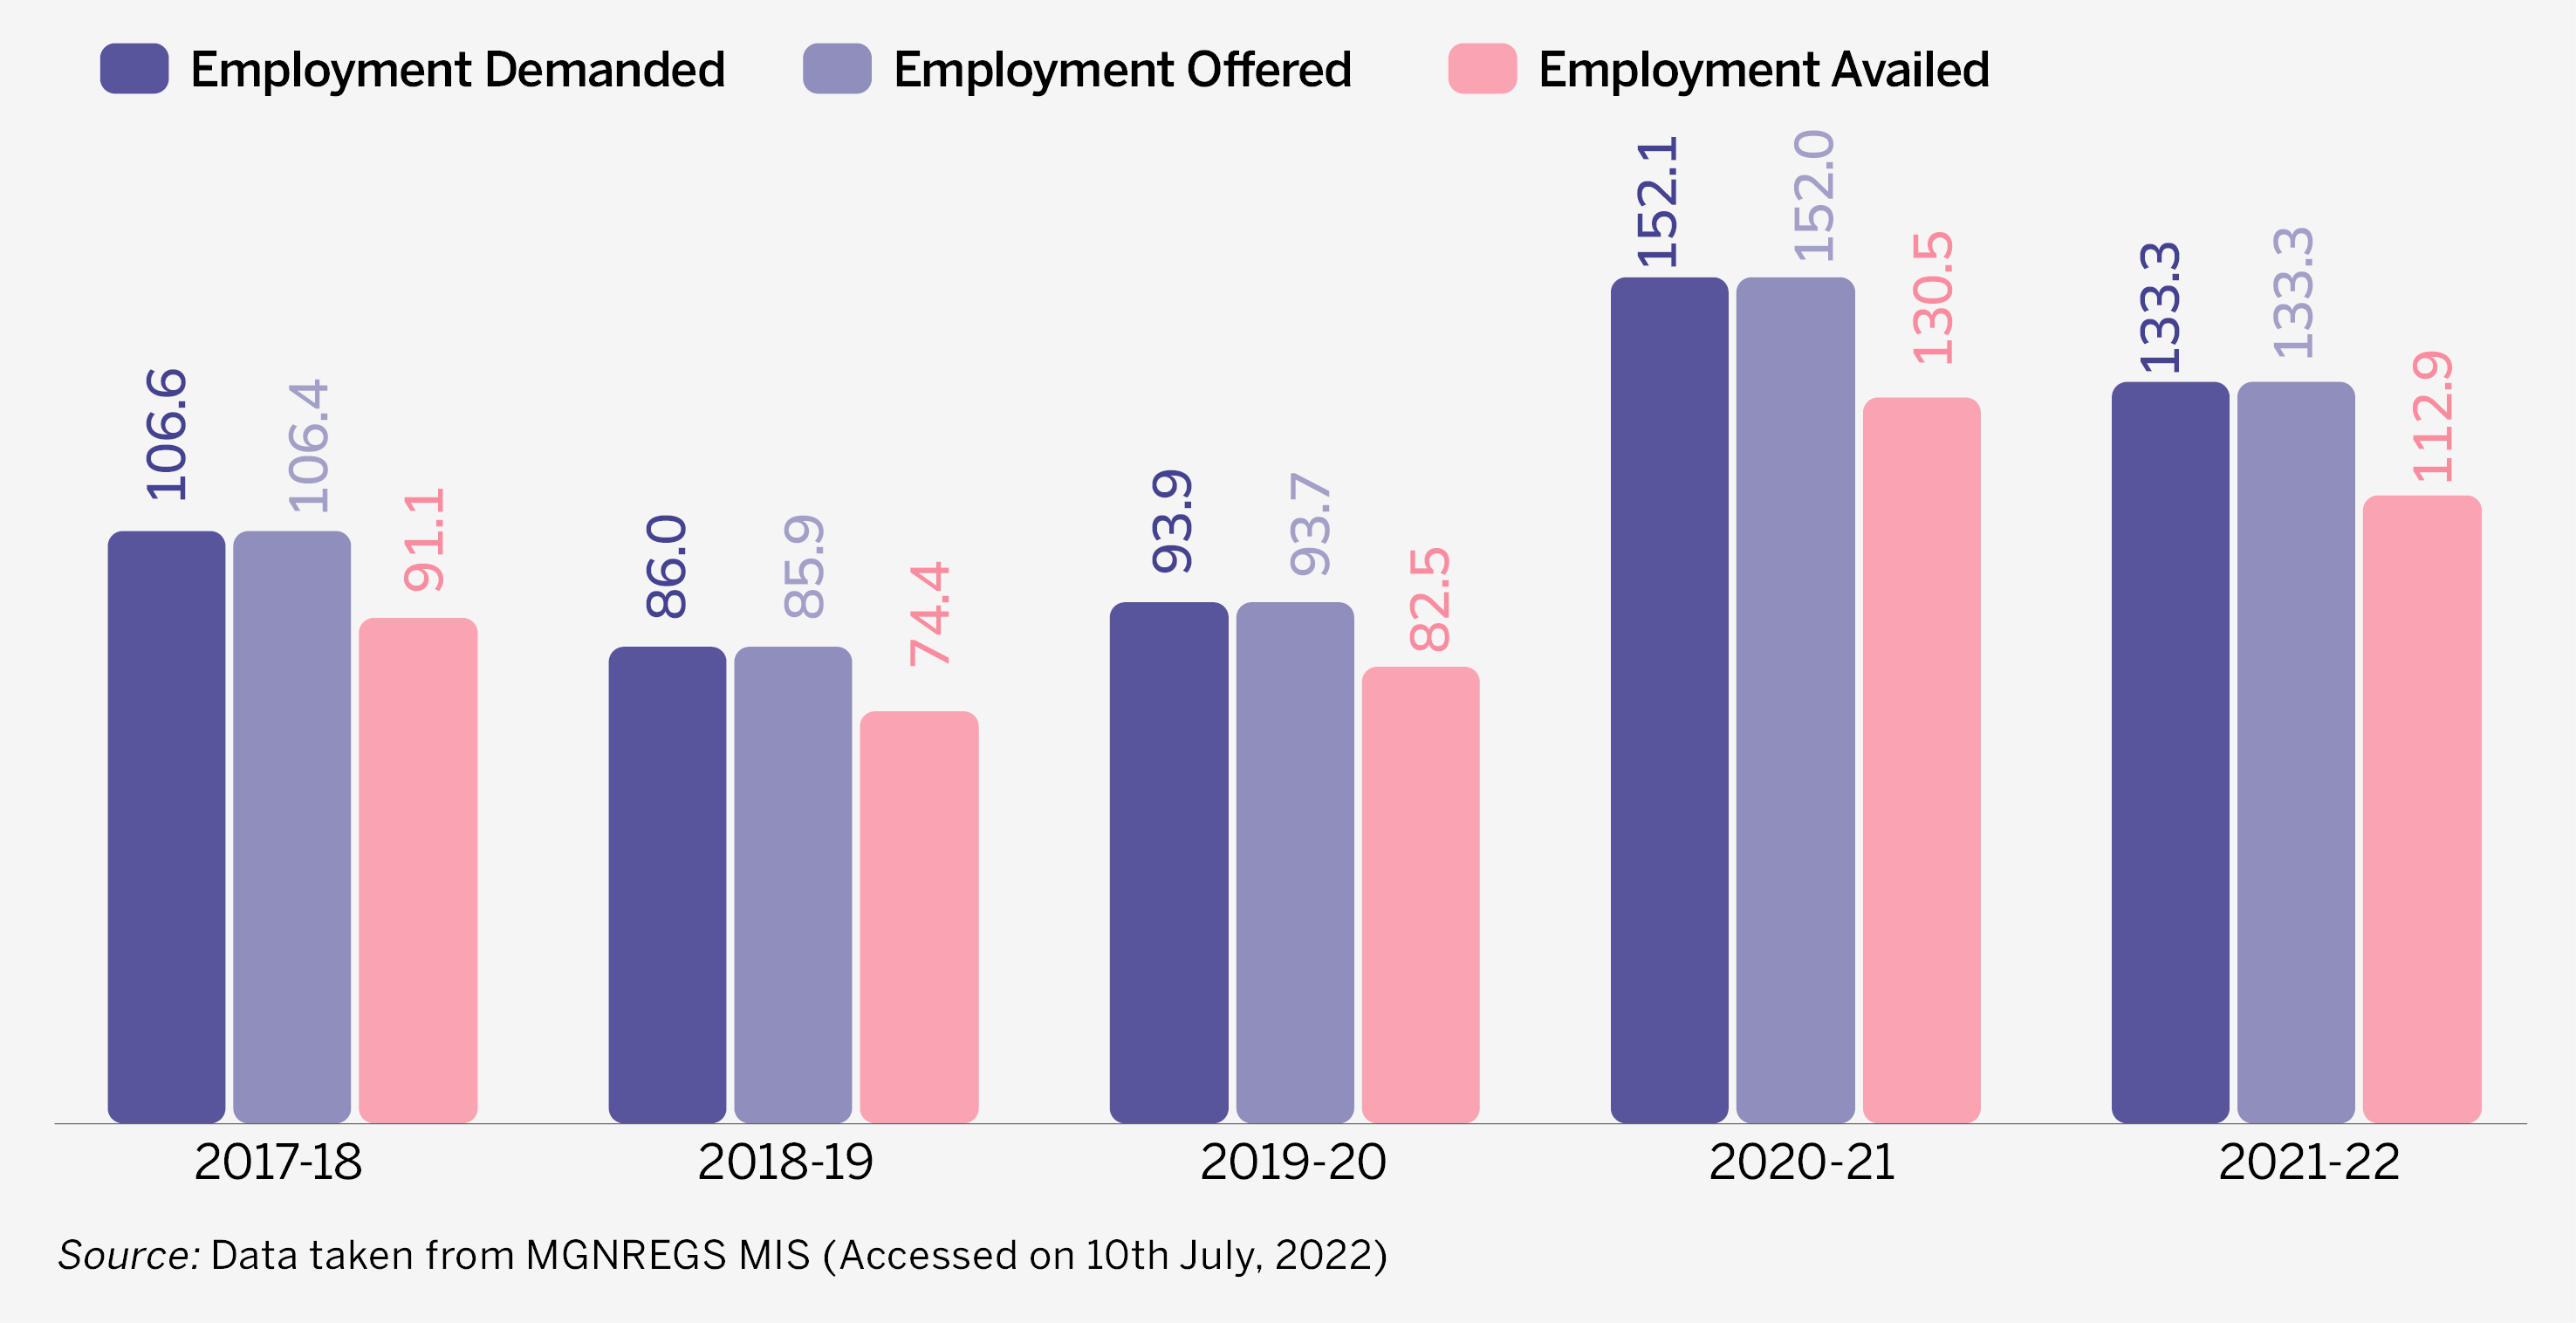
Under the scheme, all rural households whose adult members are willing to do unskilled manual work, and demand the same, are to be given such work. In this context, there are three datapoints: how many persons demanded (applied for) work; of those who demanded, how many were offered work; of those who were offered work, how many availed the work. These indicators are presented below.

Figure 7: Trends in Employment Demanded, Offered and Availed (No. of Persons in 1,000)

  • The number of persons demanding employment increased 62% in 2020-21, compared to 2019-20. This points to the impact of the COVID-19 induced crisis in the job market, causing many who were earning from other sources to turn to MGNREGS for employment.
  • In 2021-22, the number of persons demanding employment as well as those availing it decreased by 13% compared to 2020-21. This likely indicates that some people are returning to employment opportunities outside MGNREGS.
  • In all five years of our analysis period, almost everyone who demanded employment under the scheme was offered employment.
  • However, in all five years, the number of persons who availed employment was much lower than the number who were offered.
  • The average number of days a person worked in a financial year ranged from 25 (in 2018-19) to 38 (in 2020-21), which is much below the 100 days guaranteed under the scheme. This needs to be investigated further to identify the underlying reasons.
  • Of the households that were provided employment, the share of those that completed 100 days of employment ranged from 2.7% in 2018-19 to 11.6% in 2020-21.

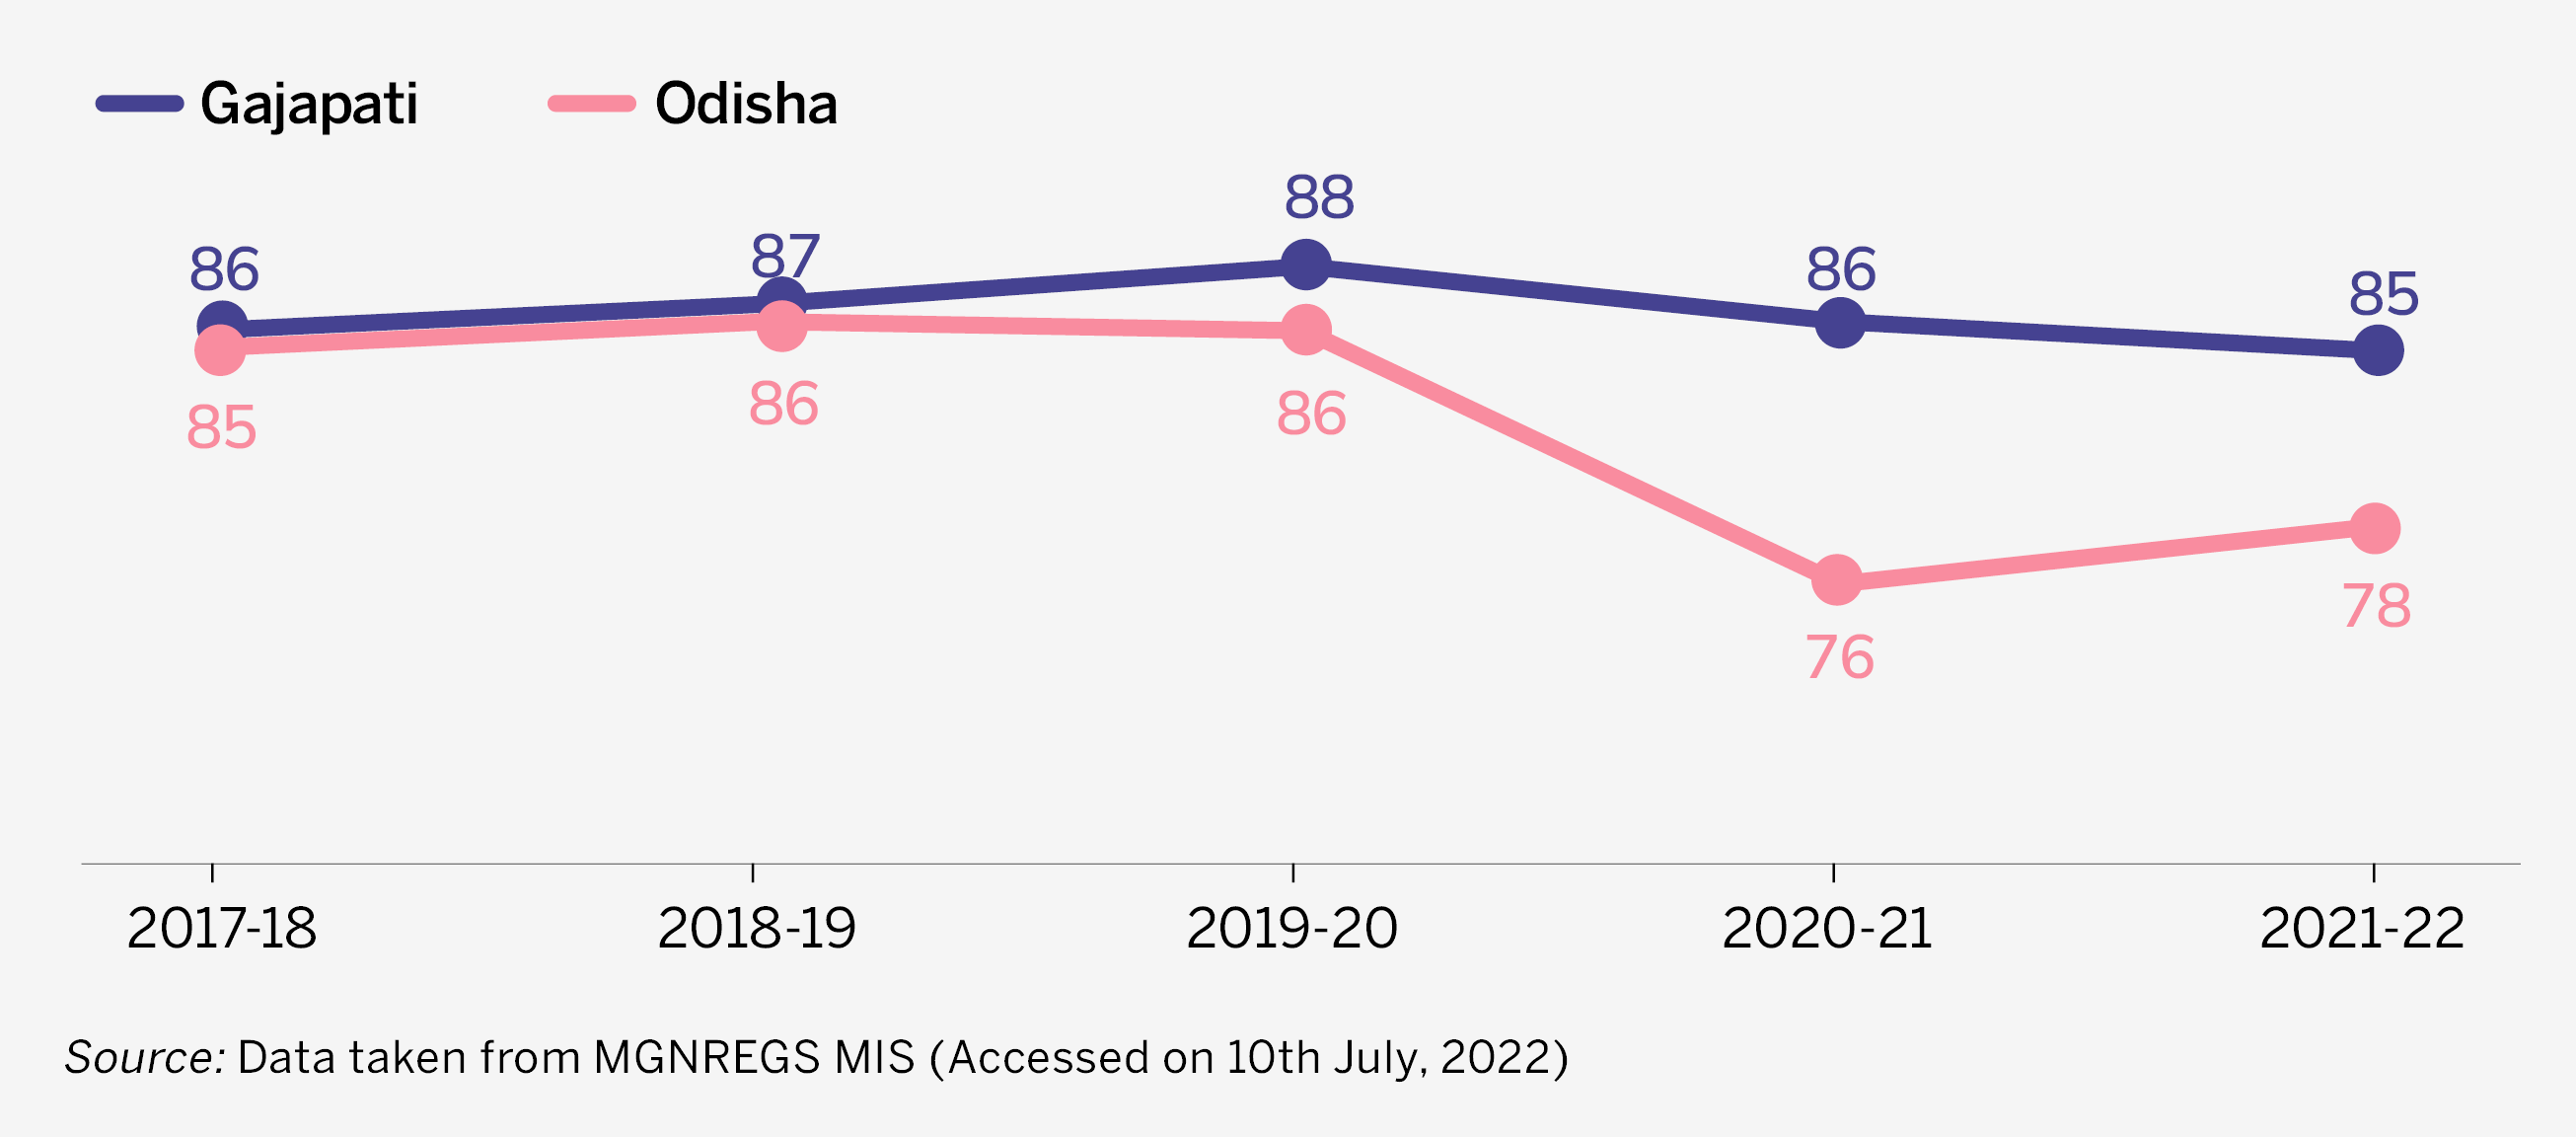
Not all persons who are offered employment availed it, for various reasons. Figure 8 compares the district with the state on the percentage of people who availed employment out of those who were offered employment.

Figure 8: Out of All Who Were Offered Employment, What Proportion Availed It (%)

  • Before the pandemic, this proportion was almost the same for the district and the state.
  • Since the pandemic, the trends have diverged. The proportion at the district is higher than the state.

06.

How Has Employment Been Distributed Across Gender?

Section titled How Has Employment Been Distributed Across Gender?

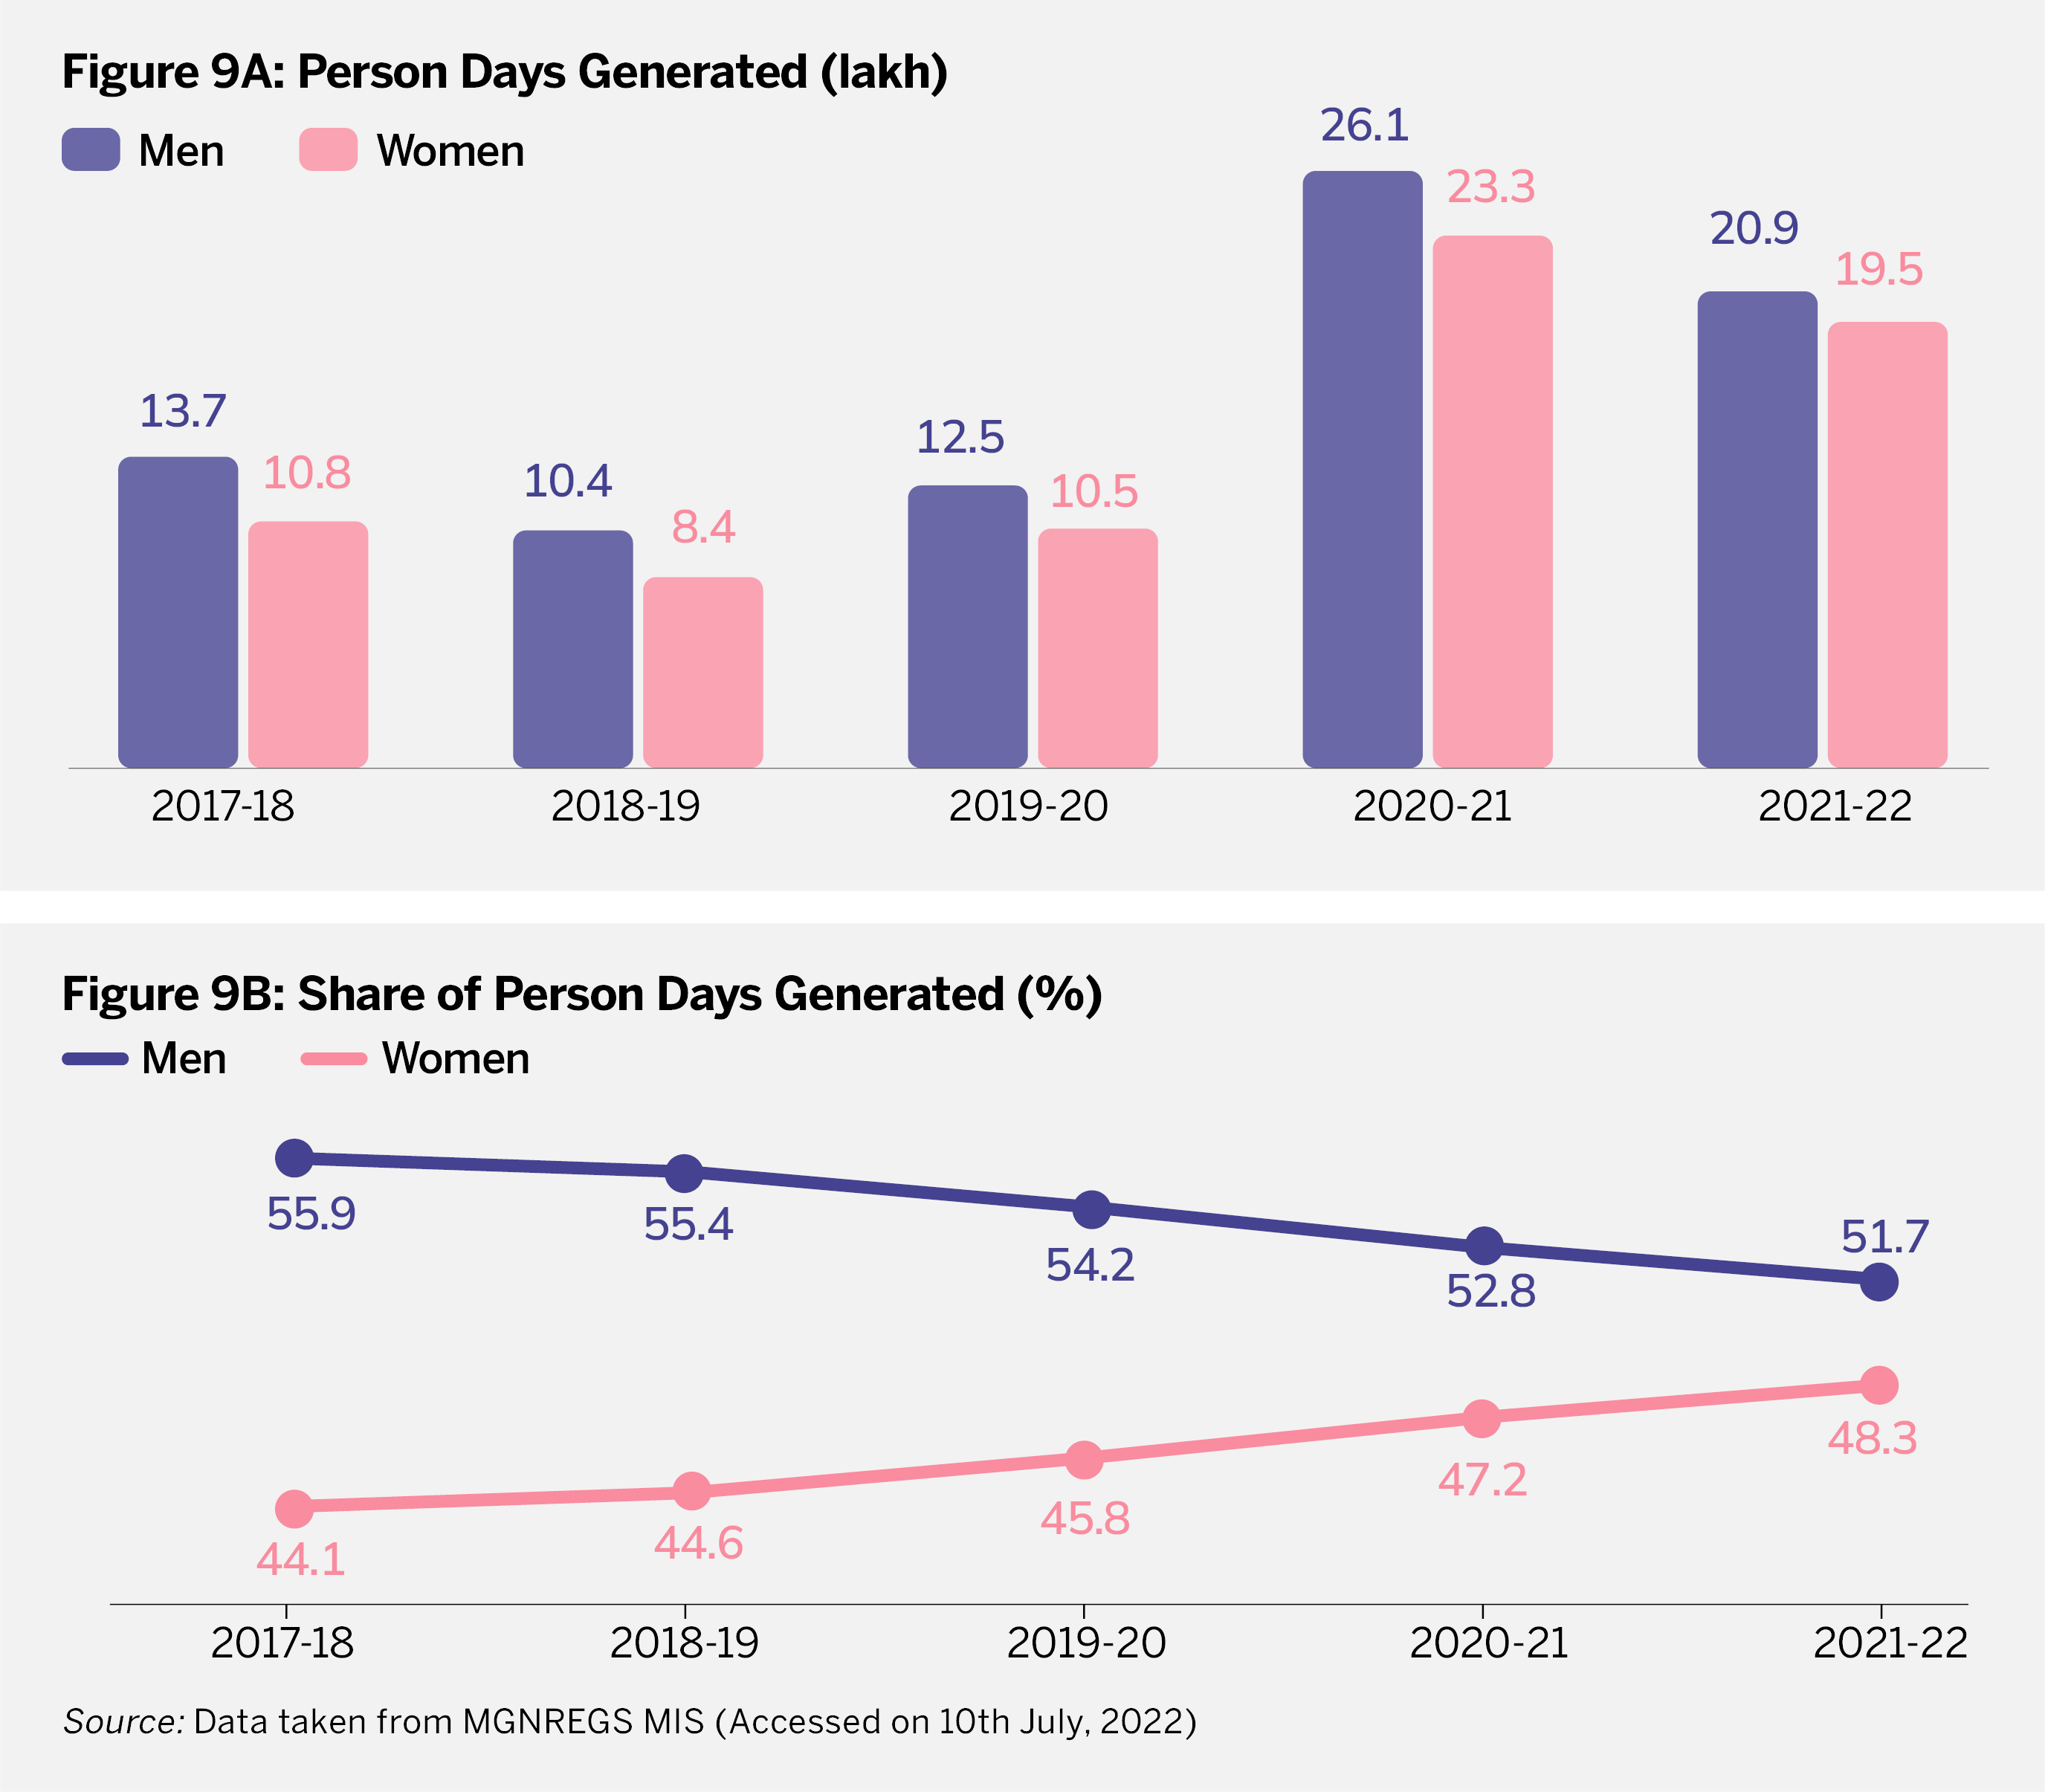
Figure 9 presents the employment data divided by gender.

Figure 9: Gender Disaggregated Data

  • Both men and women registered an increase in the number of employed days between 2018-19 and 2020-21.
  • The share of women in person-days generated has been increasing continuously in these five years.
  • The rising share of women in person-days needs further research as it can be due to different factors like a relatively higher preference for MGNREGS or a lack of opportunities beyond MGNREGS.

07.

How Has Employment Been Distributed Across Scheduled Tribes and Scheduled Castes?

Section titled How Has Employment Been Distributed Across Scheduled Tribes and Scheduled Castes?

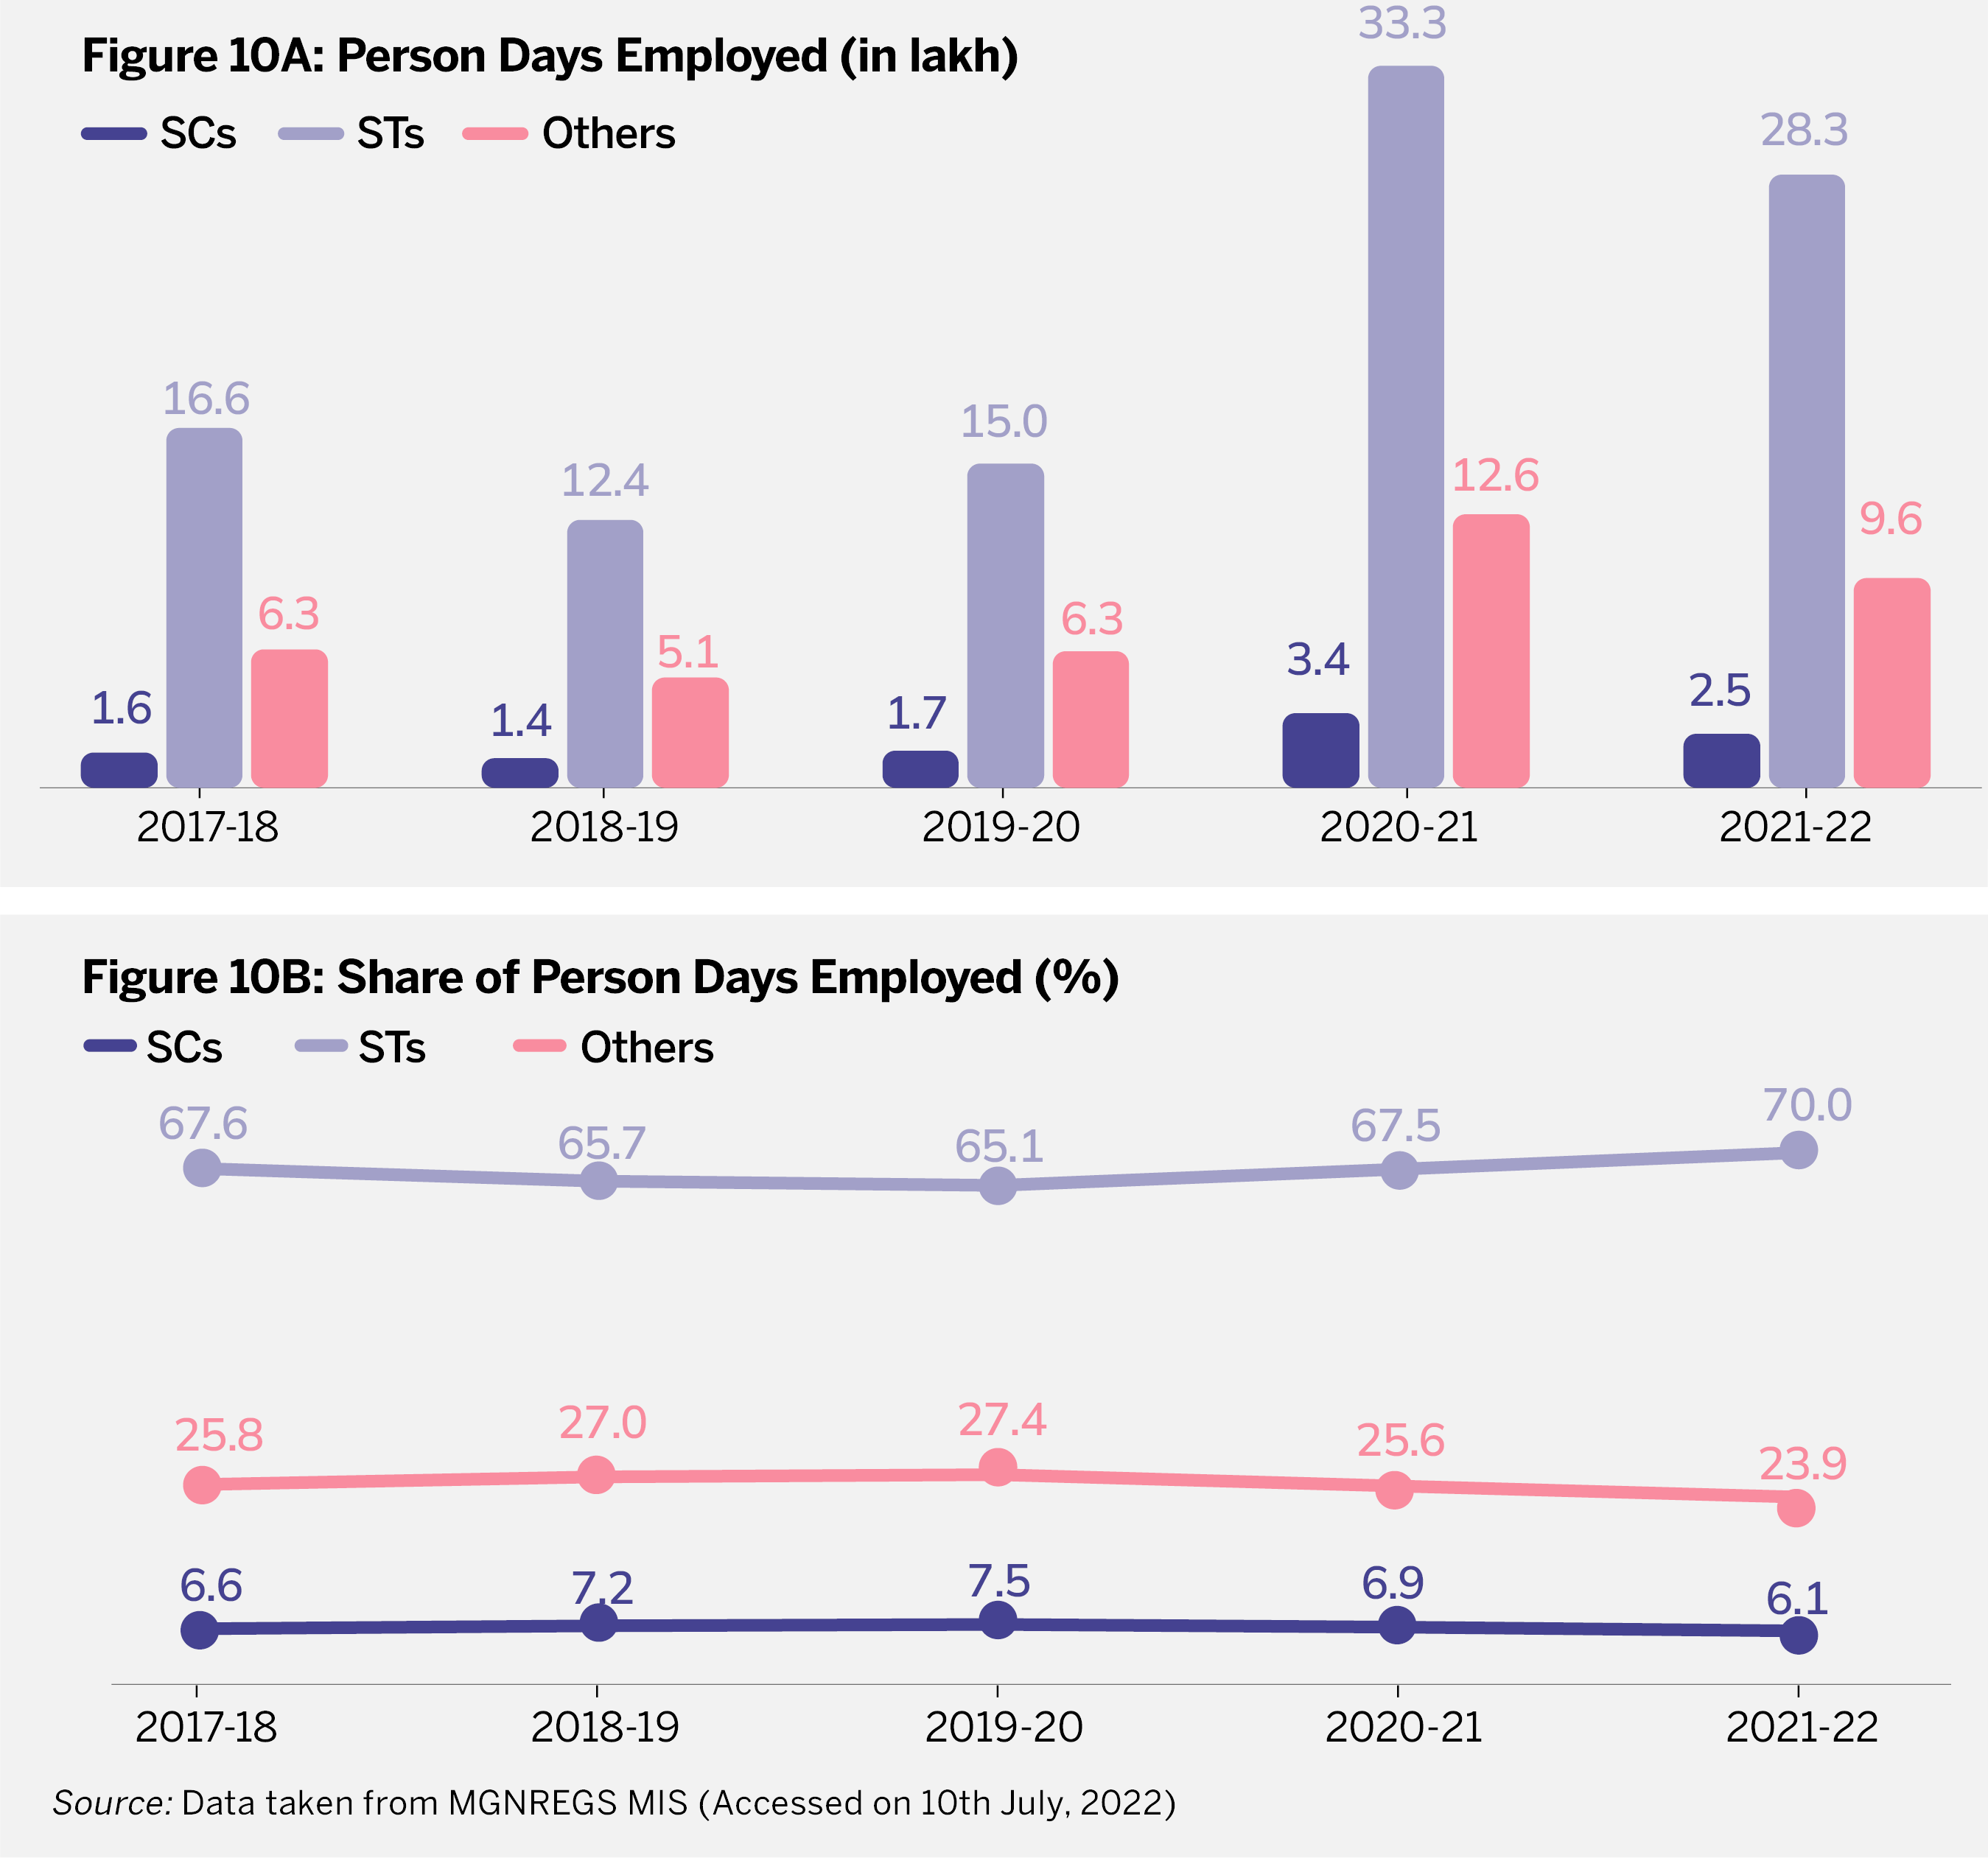
Figure 10 represent the person-days availed, in absolute and relative terms, by the three social groups: Scheduled Tribes (STs), Scheduled Castes (SCs) and others.

Figure 10: Employment for STs and SCs

  • All three population groups (SCs, STs, and others) have registered an increase, of varying degree, in work-days between 2018-19 and 2021-22
  • The share of STs in work-days has increased from 65.7% in 2018-19 to 70% in 2021-22. In the same period, the share of SCs in work-days has declined slightly from 7.5% to 6.1%.
  • The share of work-days for STs and SCs compares favourably with their share in the district population, which is 54.3% and 6.8%, respectively.

08.

Where Does the District Stand on Information Available for MGNREGS?

Section titled Where Does the District Stand on Information Available for MGNREGS?

Given the importance of the scheme in generating livelihoods for a large number of people, different data points/information related to the scheme should be available and accessible by the common masses. Figure 11 compiles a list of essential data points/information regarding MGNREGS that would of interest to various stakeholders, and hence must be available and accessible for the district. 
The data points/information regarding MGNREGS is available on the MIS of the scheme: (http://mnregaweb4.nic.in/netnrega/MISreport4.aspx). The Data accessed on 20th June, 2022.

Transparency and Accountability Index for MGNREGS in Gajapati

Availability of Information and Comprehensiveness

  • Information on funds available
    • Yes
  • Information on funds utilized
    • Yes
  • Delays in compensation and the reasons thereof'
    • Yes
  • Status of beneficiaries’ accounts (frozen or unfrozen)
    • Details on number of frozen accounts is available, but beneficiaries may not be able to check their status.
  • Information on ‘number of person-days’ of jobs generated
    • Yes
  • Gender-wise disaggregation of beneficiaries’ data
    • Yes
  • Disaggregation of beneficiaries’ data by social groups
    • Yes
  • Availability of information on work/project undertaken
    • Yes
  • Geographical granularity of the fiscal indicator
    • Houeshold

Accessibility

  • Language of availability of information
    • English only (Addition of Hindi and Odiya could also help beneficiaries)
  • Compatibility on devices
    • Phone, tablet, laptop friendly. But there’s no back button due to Captcha, which makes it a little cumbersome for users.

Timeliness

  • Frequency of data updation
    • Real-Time

Relevance

  • How relevant would users find it
    • It is largely useful and relevant for policymakers, civil society organizations (CSOs) and researchers. It can be made more relevant to beneficiaries. For instance, data on the number of projects, job-card holders, etc. is useful for researchers and CSOs; information on convergence of MGNREGS with other schemes and so on will be useful for policymakers and administrators, etc. However, beneficiaries cannot check their particular account status or delayed compensations, etc. 

Reliability

  • Whether the data is reliable
    • While Comptroller and Auditor General (CAG) audit reports for MGNREGS are available, authenticating with MIS as well as ground-truthing is essential. 

Accountability and Citizen’s Participation

  • Social Audit schedules
    • Social audit calendars are not available in the recent years.
  • Availability of social audit reports
    • Gram Panchayat social audit reports are available for some Panchayats in some years, based on selection for social audit.
  • Participation of beneficiaries in Gram Sabhas
    • Although details on action taken after social audits are available, information on the number of beneficiaries as participants is not available; just the total number of participants in the Gram Sabhas is given.
  • Availability of details on financial misappropriation and recovery
    • Yes
  • Availability of information on Grievance Redressal Mechanism for beneficiaries

CREDITS

Author: Suraj Jaiswal

Series Edited by: Nilachala Acharya, Subrat Das

Editorial Inputs: Manish Kumar, Manik Tiwari

Designed by: Flying Saints

Graphics by: How India Lives

Back to Top