Skip to content
-

Barabanki (Uttar Pradesh)

Mid-Day Meal Scheme (MDM)

This factsheet presents an analysis of the performance of the Mid-Day Meal or MDM (Now Pradhan Mantri Poshan Shakti Nirman or PM POSHAN) for the district of Barabanki (Uttar Pradesh).

Barabanki lies in the central part of the Middle Ganga Plain. It consists of 15 blocks. While the district is mainly dependent on agriculture, major industries in the region include spinning and agro-based units. Read more about Barabanki

The MDM scheme (now Pradhan Mantri Poshan Shakti Nirman or PM POSHAN) is a flagship programme of the Government of India to enhance enrolment, retention and attendance. Read more about MDM.

01.

Has MDM Helped Increase Enrolment of Students in Gajapati?

Section titled Has MDM Helped Increase Enrolment of Students in Gajapati?

One of the objectives of the scheme is to increase enrolment of students. Figure 1 shows the trend of enrolment in all schools in the district where MDM is provided.

  • In the four years from 2017-18 to 2020-21, there has been an average annual increase of 2.3% in enrolment in schools that provide MDM (government schools and government-aided schools).
  • Over the same period, the average annual increase for the state was 1.7%.
  • The average annual increase In Barabanki was more at the upper primary level (4.4%) than the primary level (1.5%).

Figure 1: Total Enrolment in Schools Providing MDM

02.

How Many Students were Approved for MDM and How Many Availed it?

Section titled How Many Students were Approved for MDM and How Many Availed it?

The programme approval board (PAB) approves the number of students to be provided benefits under MDM scheme every year, based on state proposals. However, the number of students approved is generally lower than the number of students enrolled in MDM-providing schools. And, the number of students availing of the meal generally varies from the number of approved students.  Figure 2 shows the relationship between these three sets of numbers.

  • The relationship between the three metrics has varied over time.
  • While the number of approved students was around half the number of enrolments in the first three years, it exceeded the number of enrolments in 2020-21. One possible reason could be that the enrolment figure is taken on a particular date, generally 30th of September, and might have been different at the beginning of year or was projected to be higher when the plan was approved.
  • Also, in 2020-21, schools were shut due to Covid-19, and hence the number of meals provided in schools was only for a select number of days. Instead, the government provided a food security allowance directly to students in the form of foodgrains and monetary support for cooking. Because of this change, all students received the benefits compared to earlier, when many did not avail of the meal.

Figure 2: Number of Students: Enrolled vs Approved vs Availed

Figure 3 shows compares Barabanki with the state of Uttar Pradesh on the share of enrolled students approved for mid-day meals.

  • Both district and state show the same trend.
  • Between 2017-18 and 2019-20, the share of approvals was similar, with the district lagging the state by around 10 percentage points.
  • In 2020-21, the share increased sharply in both the district and the state, and crossed 100%.

Figure 3: Percentage of enrolled students approved for MDM

04.

How Does the District Compare with the State on Fund Utilisation?

Section titled How Does the District Compare with the State on Fund Utilisation?

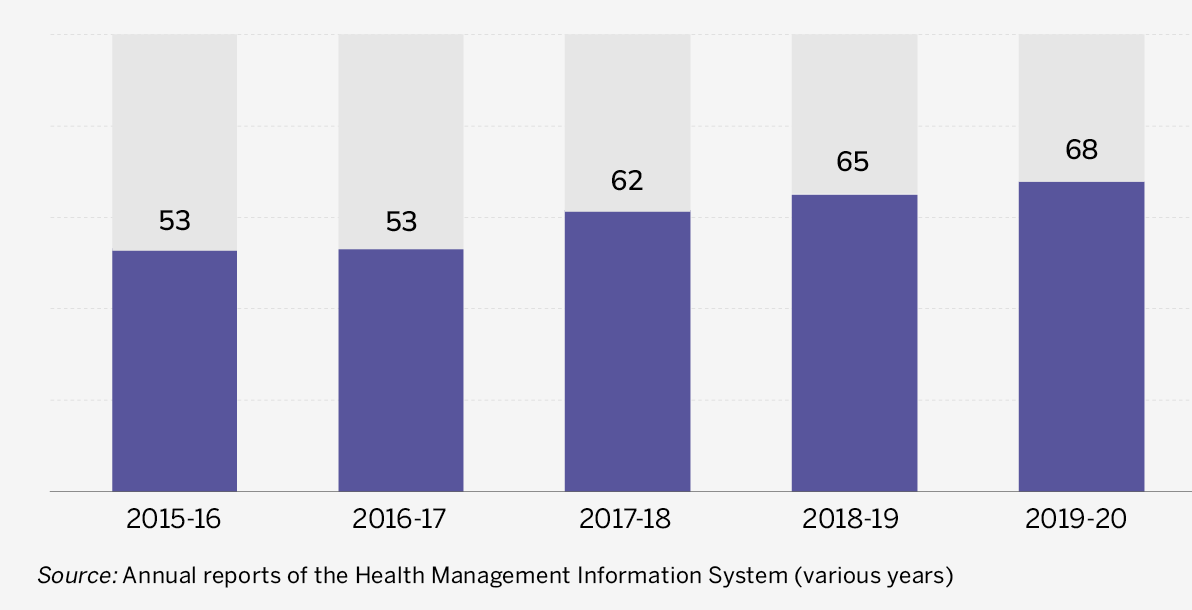
Utilisation is measured as the expenditure made out of the total funds available, which, in turn, is the sum of the opening balance and funds received during the financial year. Figure 5 shows the utilisation rates for the district and the state.

  • The fund utilisation of Barabanki exceeded that of the state in all years except 2020-21.
  • Both the district and the state saw fund utilisation drop in 2019-20.  The main reason appears to be a bigger gap between the number of days for which meals were approved and the number of days on which meals were served.  In 2018-19, these figures were 244 days and 249 days, respectively. In 2019-20, they were 189 days and 169 days, respectively.
  • In absolute terms, both the district and the state saw expenditure fall in 2019-20, but the high level of utilisation in the district is due to the relatively greater fall in funds available.

Figure 5: Rate of Fund Utilisation at District and State level (%)

05.

What is the Breakup of Funds Across the Four Components?

Section titled What is the Breakup of Funds Across the Four Components?

Figure 6 shows the funds available in four components.

  • Allocation to each component is based on a unit value: distance for transportation, defined amount for foodgrains, pre-defined wage rate for CCH, and defined unit value for cooking cost.
  • Three components—transport, foodgrains and honorarium to CCH—show a gradual increase over the years.
  • Cooking cost has seen wide fluctuation, especially in the last two years.
  • In 2019-20, cooking cost saw a 36% year-on-year decline in funding available to Rs 14 crore, while the allocation remained the same at Rs 23 crore. The decline in funding available, in spite of the same allocation, was due to lower funding received during the year and a Rs. 4.4 crore payment due from the previous year.

Figure 6: Funds available to different components (Rs lakh)

Figure 7 shows the share of each component in the combined expenditure between 2017-18 and 2021-22.

  • In these four years combined, cooking cost had the highest share in total expenditure, of 75%.
  • Transport had the lowest share in total expenditure, of 1.1%.
  • Changes in the share of components were either because of a decline in their own value or an increase in another component’s value. In 2018-19, the share of CCH fell due to a decline in CCH expenditure and an increase in expenditure on cooking costs.
  • In 2019-20, the actual value of all four components fell, but the fall was relatively more for foodgrains and transport, which increased the share of cooking cost.

Figure 7: Share of different components in total expenditure (%)

06.

How does Fund Utilisation by the District Compare with that of the State?

Section titled How does Fund Utilisation by the District Compare with that of the State?

Figure 8 shows the utilisation rate for all four components for the district and the state.

  • Utilisation rate has the same trend in the district and state for three components: CCH, foodgrains and transport.
  • Utilisation rate of the district generally compares favourably with that of the state for the above three components.
  • For cooking costs, the trend as well as the level diverges between the district and the state.
  • The high utilisation rate in the district in 2018-19 is on account of higher-than-budgeted expenditure— Rs 26.3 crore against a fund allocation of Rs 23.6 crore.
  • The high level of utilisation in the district in 2019-20 is on account of payment of dues of the previous year as well as fewer funds being received compared to the allocation: Rs 18.5 crore versus Rs 23.9 crore.

Figure 8: Utilisation rate %

07.

Where does Gajapati Stand on Information Available for MDM?

Section titled Where does Gajapati Stand on Information Available for MDM?

Given the importance of MDM scheme in providing nutrition, and helping increase enrolment and hence education of students, data/information about the scheme should be readily available and accessible to the common masses. Figure 9 lists essential data points/information regarding MDM that will be useful to various stakeholders. The current level of information available has been evaluated for these indicators.

The data points /information regarding MDM have/has been taken from the Annual Work Plan and Budget Meeting Documents (AWB&PM) for the years from 2017-18 to 2020-21. These documents were accessed at https://pmposhan.education.gov.in/.

Transparency and Accountability Parameters

Availability of Information and Comprehensiveness

 Information on funds allocated

  • Yes

 Information on funds received

  • Yes

 Information on funds available

  • Yes

 Information on funds utilised

  • Yes

 Information on funds for different components

  • Yes

Accessibility

 Language in which information is available

  • English

 Compatibility on devices

  • Phone, tablet, laptop friendly

Timeliness

 How frequently are data updated?

  • Real-Time

Relevance

 How relevant would users find it

  • The data available in the MDM website can be used by researchers, scholars and policy makers. While the information on the website is vast, further disaggregation of data based on gender can help understand the ways MDM affects education and the nutritional status of girl children.

Reliability

 Are the data reliable?

  • CAG audit reports are not available on the MDM website, hence authenticating the data with MIS and ground verification is essential.

Accountability and Citizen’s Participation

 Social Audit schedules

  • Social auditing is mandated for all districts.
  • While the account for the number of schools covered, organisations/institutions conducting the audit and expenditure is available, the reports on the website are not up to date for all the states and years.

 Availability of information on Grievance Redressal Mechanism for beneficiaries

  • Contact details to lodge complaints are listed on the website for every state.
  • Details on the number of complaints, status of complaints and action taken are also available.
  • States follow different mechanisms for grievance redressal.

CREDITS

Author: Divya Chirayath, Ajay Pal Singh

Series Edited by: Nilachala Acharya, Subrat Das

Editorial Inputs: Suraj Prasad Jaiswal, Mitali Gupta

Designed by: Flying Saints

Graphics by: How India Lives

Back to Top